Although I have discussed many dark-matter-related topics on my blog, I insist every time on the fact that alternative theories where there is no dark matter also exist. These are also widely studied by physicists.

[image credits: Wikipedia]
This being said, I have never written anything about those alternative theories. I am intending to partly fill this gap with this post.
The topic of the day concerns galactic rotation curves. In other words, this blog post addresses the motion of stars and gas within galaxies.
These galactic rotation curves were the original motivation for introducing dark matter in the 1930s.
But modifying gravity at large distances could be another way to accommodate galaxy rotation curve data.
WHY INTRODUCING DARK MATTER IN THE FIRST PLACE?
The origins of dark matter can be traced back to the 1930s, when a scientist named Fritz Zwicky studied a distant cluster of galaxies named the Coma cluster. His studies consist of the first indirect evidence for dark matter.
[image credits: arXiv]
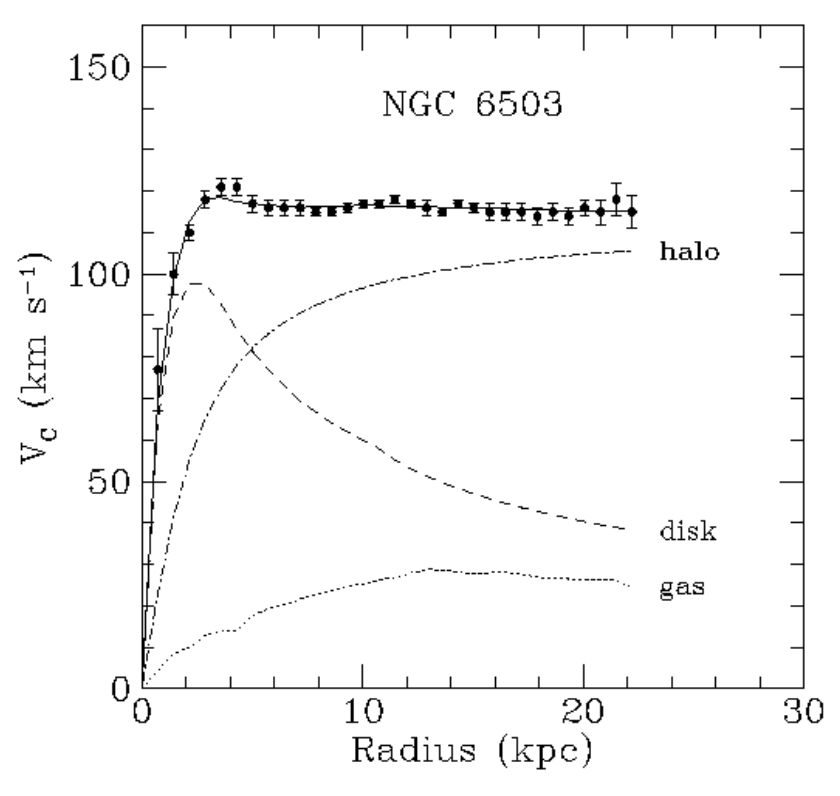
The results are illustrated on the picture on the left. In a few words, this figure depicts the circular motion of stars and gas in a distant galaxy.
Let us detail what this figure means more precisely.
To make such a figure, one reports the velocity of the stars as a function of their distance from the galactic center. Those are the data points (squares on the figure).
Now, of course, we want to confront data to theory (this is the scientific method after all). To this aim, we need to superimpose theory predictions to the data points.
One simple way to make predictions is to use Newtonian mechanics (or in other words, standard gravitational interactions). Starting from the mass of the visible stars and gas in the considered galaxy, we obtain the dotted line of the figure (the line labeled as ‘gas’).
It is clear that data and Newtonian mechanics disagree. Zwicky decided to leave gravity as it is and therefore postulates the existence of dark matter.
Including dark matter in the galaxy disk (labeled as ‘disk’) and around the galaxy (labeled as ‘halo’), the sum of all contributions (the solid line) matches data.
From that time, the results of Zwicky have been reproduced in the context of other galaxies, and many extra indirect evidences tend to support the dark matter hypothesis (cosmic microwave background, the formation of structures in the universe, etc.).
IF GRAVITY WAS DIFFERENT FROM WHAT WE THINK IT IS
In order to restore agreement between theory and data, one can postulate the existence of dark matter. This is what we have done in the previous section.
However, this is not the only option. One could equally modify how gravity works at large distances to get a theory-data agreement. In other words, we modify the theory and do not touch the content of the universe.

[image credits: Wikipedia]
Those theories are called MOND theories, and were first introduced by Mordehai Milgrom.
MOND is by the way an acronym for MOdification of Newtonian Dynamics. The name speaks for itself.
All the indirect evidences for dark matter can actually be explained in the MOND context too, although in some cases, it is feasible but not that obvious.
By modifying gravity, the dotted ‘gas’ curve in the above figure is modified so that it reproduces the data well.
CAN WE DISENTANGLE DARK MATTER FROM MOND?
Very recently, two physicists reanalyzed 129 galactic rotation curves both in the dark matter and the MOND contexts. They wanted to investigate how differences could appear in the predictions, so that we could potentially exclude one of the two hypotheses.
Their results are available here.
First, in order to be able to find out which hypothesis is the correct one, one needs to design a quantity for which the two predictions are different enough so that conclusive statements can be drawn.
They introduced the so-called g2-space, which consists of a two-dimensional space where two different properties of the stars moving in distant galaxies are reported: gbar and gobs
The first of these quantities, gbar(r), consists of the acceleration that the different stars would get if only the visible matter would be responsible for it. It depends on the distance from the galactic center r.
The second of these quantities, gobs(r), consists of the observed acceleration. Again, it varies with the distance from the galactic center.
Let us now move on with a sketch of what the MOND and dark matter predictions could look like in the g2-space.

[image credits: arXiv]
For a given star, r is fixed (a star lies at a given distance from the galactic center and that’s it) and one gets a couple of (gbar, gobs) values.
We thus have one couple of values for each star in a galaxy.
In the figure on the left, the predictions for MOND are shown in blue and those for dark matter in red.
When the distance to the galactic center is increased, one starts from the (0,0) point (the origin of the axes) and finally gets to an ‘rpeak point’ that lies at different place on the g2 plane. This consists of the rightmost point in both cases.
Then, when one continues in probing larger r values, the MOND points go back to the origin in the same way they got to the rpeak point, whilst the dark matter points follow another path.
With precise enough data, we have thus a way to disentangle both models as the predictions are totally different.
DATA, DISCUSSION AND REFERENCES
By reporting the (gbar, gobs) values for each star of a given galaxy, one could add data points in the g2-space plane introduced above.
To repeat, as the MOND and dark matter predictions differ by a lot, in particular for small distances, we have a handle to distinguish both models and tell which one is correct and which one is wrong.
Of course, the above picture is a sketch and reality may be slightly different…
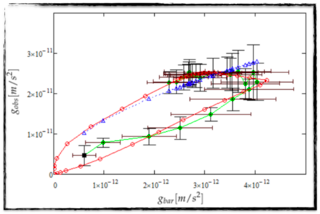
[image credits: arXiv]
In the figure on the right, we investigate a galaxy named NGC 3109. The blue line corresponds to the actual MOND predictions, and the red lines to the dark matter predictions.
The green line consists of data, with the black error bars.
Although it seems that data tends to favor the dark matter hypothesis (in particular on the left of the figure), the error bars are still huge so that one should be careful with conclusions.

[image credits: Wikipedia]
129 galaxies have been tested, and MOND actually fits the data better for 93 of these galaxies.
But in all cases, the huge error bars do not allow for rejecting the dark matter hypothesis that actually fits the data well too.
On different grounds, large deviations between MOND predictions and data have been found for a significant number of galaxies. We are talking here of deviations at the 3sigma level, which means 1 chance out of 370 that we are unlucky.
To sum up, galaxy rotation curves are one of the very first motivation for dark matter. However, interestingly enough, the MOND non-dark-matter hypothesis cannot be excluded at an extremely good confidence level with curent galaxy rotation curve data.
The future will tell us more, definitely, when more data will be recorded.
For more information, one can have a look first here for general information about MOND and then there for the article in which the MOND and dark matter hypotheses are compared in the context of the galaxy rotation curves.
For more discussion on this topic (or anything related to science), please join us on steemSTEM. SteemSTEM is a community driven project which seeks to promote well written/informative Science Technology Engineering and Mathematics postings on Steemit. More information can be found on the @steemstem blog.