With the inflationary nature of STEEM, looking at a traditional price chart for the currency is going to show a skewed perspective. The reason is because STEEM is not meant to be held as a long-term investment. The constant sell pressure from additional STEEM being created and sold on the exchanges will always put a downward pressure on the price.
Steem Power is meant to be a cushion against the inflation. The unit of a Steem Power is called a "vest". When you power up, you will get a certain number of 'vests' for the STEEM that you agree to lock up as part of the 2 year contract. As part of that contract, the blockchain will continue to add more STEEM to your vest in order to hedge against the inflation.
After powering up, the number of vests that you have will not change; but the amount of STEEM that you have powered up will. Unless of course you change the number of vests by powering down (which will decrease your vests), powering up (which will increase your vests), curating (which will increase), receiving author rewards (increase), etc. The important thing though is your vests remain yours unless you do something to change them.
When looking at historic price data for STEEM, all the exchange and price sites will show you the price of STEEM. For an investor in Steem Power, this information is useful, but it does not tell the whole story. As a holder of vests, they will be getting new STEEM added to their account at the same time that the price of STEEM is going up/down (usually down). When you have the price of STEEM going down, but the number of STEEM per vest going up - the two start to cancel each other out. The rate at which the price goes down compared to the rate at which the amount of STEEM goes up is important to determine if the overall value of your vests is going up or down.
Disclaimer:
All of the data below was collected and calculated by me by hand. I worked hard to ensure its accuracy, but I cannot guarantee the numbers are 100% correct. The numbers were taken in 7 day increments. Also, there is going to be some slight skewing of the numbers because the time-stamps of the data-points that were collected from the various sites were not at exactly the same times. (Example the price of STEEM may have been from 7:30, but the price of BTC might have been from 9:15.) Other users are encouraged to follow the steps that I did to ensure the accuracy of the data and calculations. The use of alternate data sources to cross-check the numbers is encouraged as well.
This graph shows the value of 1 MVEST of Steem Power from 6/19/2016-10/30/2016:
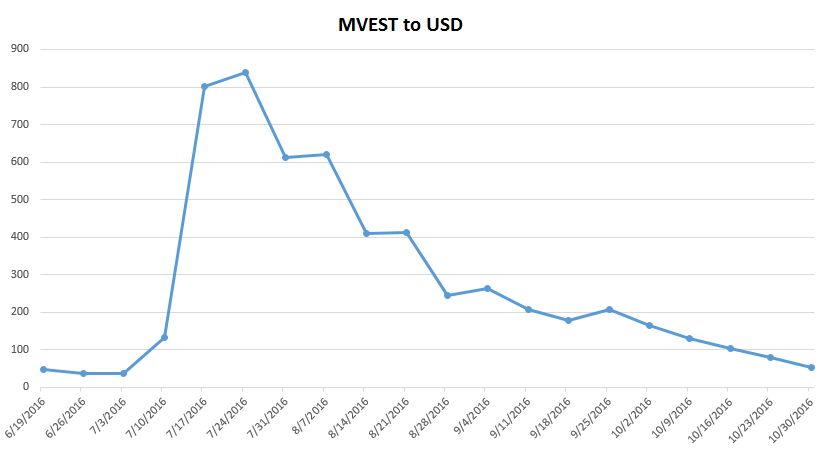
This is probably the most important part of what the data shows though:
1 MVEST today is still worth slightly more than it was pre-price pump! Steem Power vests have actually gone up in value if you look at the historical price data!
This is the same graph, with a historic floor drawn in based on pre-pump prices:

Data Sources:
BTC Price Data: http://www.coindesk.com/price/
STEEM Price Data: http://coinmarketcap.com
MVESTs/STEEM Data: https://steemd.com/@steemit (weekly power downs)
Raw Data:
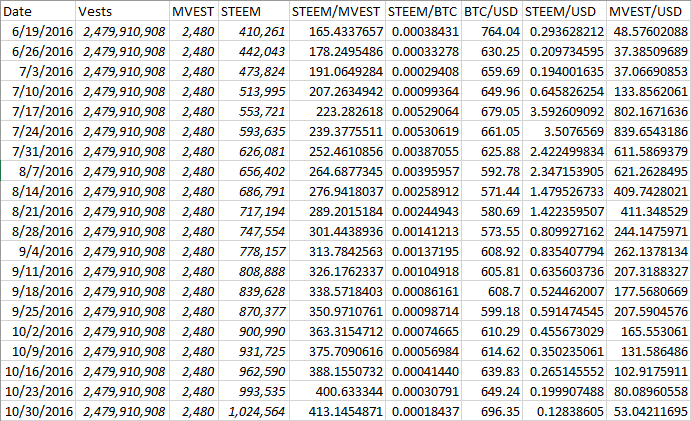
Reminder - Please read the disclaimer above regarding the accuracy of the data.