I recently made a post which discussed some Technical Analysis thoughts for the current Ethereum chart:
@xaero1/ethereum-ta-discussion-bollinger-bands-tightening-due-for-a-breakout-or-break-down
After I made the post, I thought of a few more things about the current situation - so I've therefore made this extra post so that I could mention these additional points (as follows) :)
(1) What's bitcoin doing (fundamentals)?
It seems that at the moment, bitcoin is having quite a significant influence on the rest of the market. First thing to mention is that there's a plan for a new coin called 'Bitcoin Cash' (BCC) to be forked off on August 1st. Could this lead to volatility or decline in the price of bitcoin as this date approaches, and could this affect the rest of the market? On the other hand, segwit should activate soon. However, although generally regarded as a positive enhancement, there's always the chance that this could result in a 'buy rumour / sell the news' situation. During the recent activation of segwit on litecoin, for example, there was a spike up at the point of activation, but this sharply retreated immediately afterwards. In other words, maybe trading will be a bit less of a risky business after these events have been resolved (on way or another)?(!)
(2) What's bitcoin doing (technicals)?
Here's the 2-hour bitcoin chart (bitfinex):
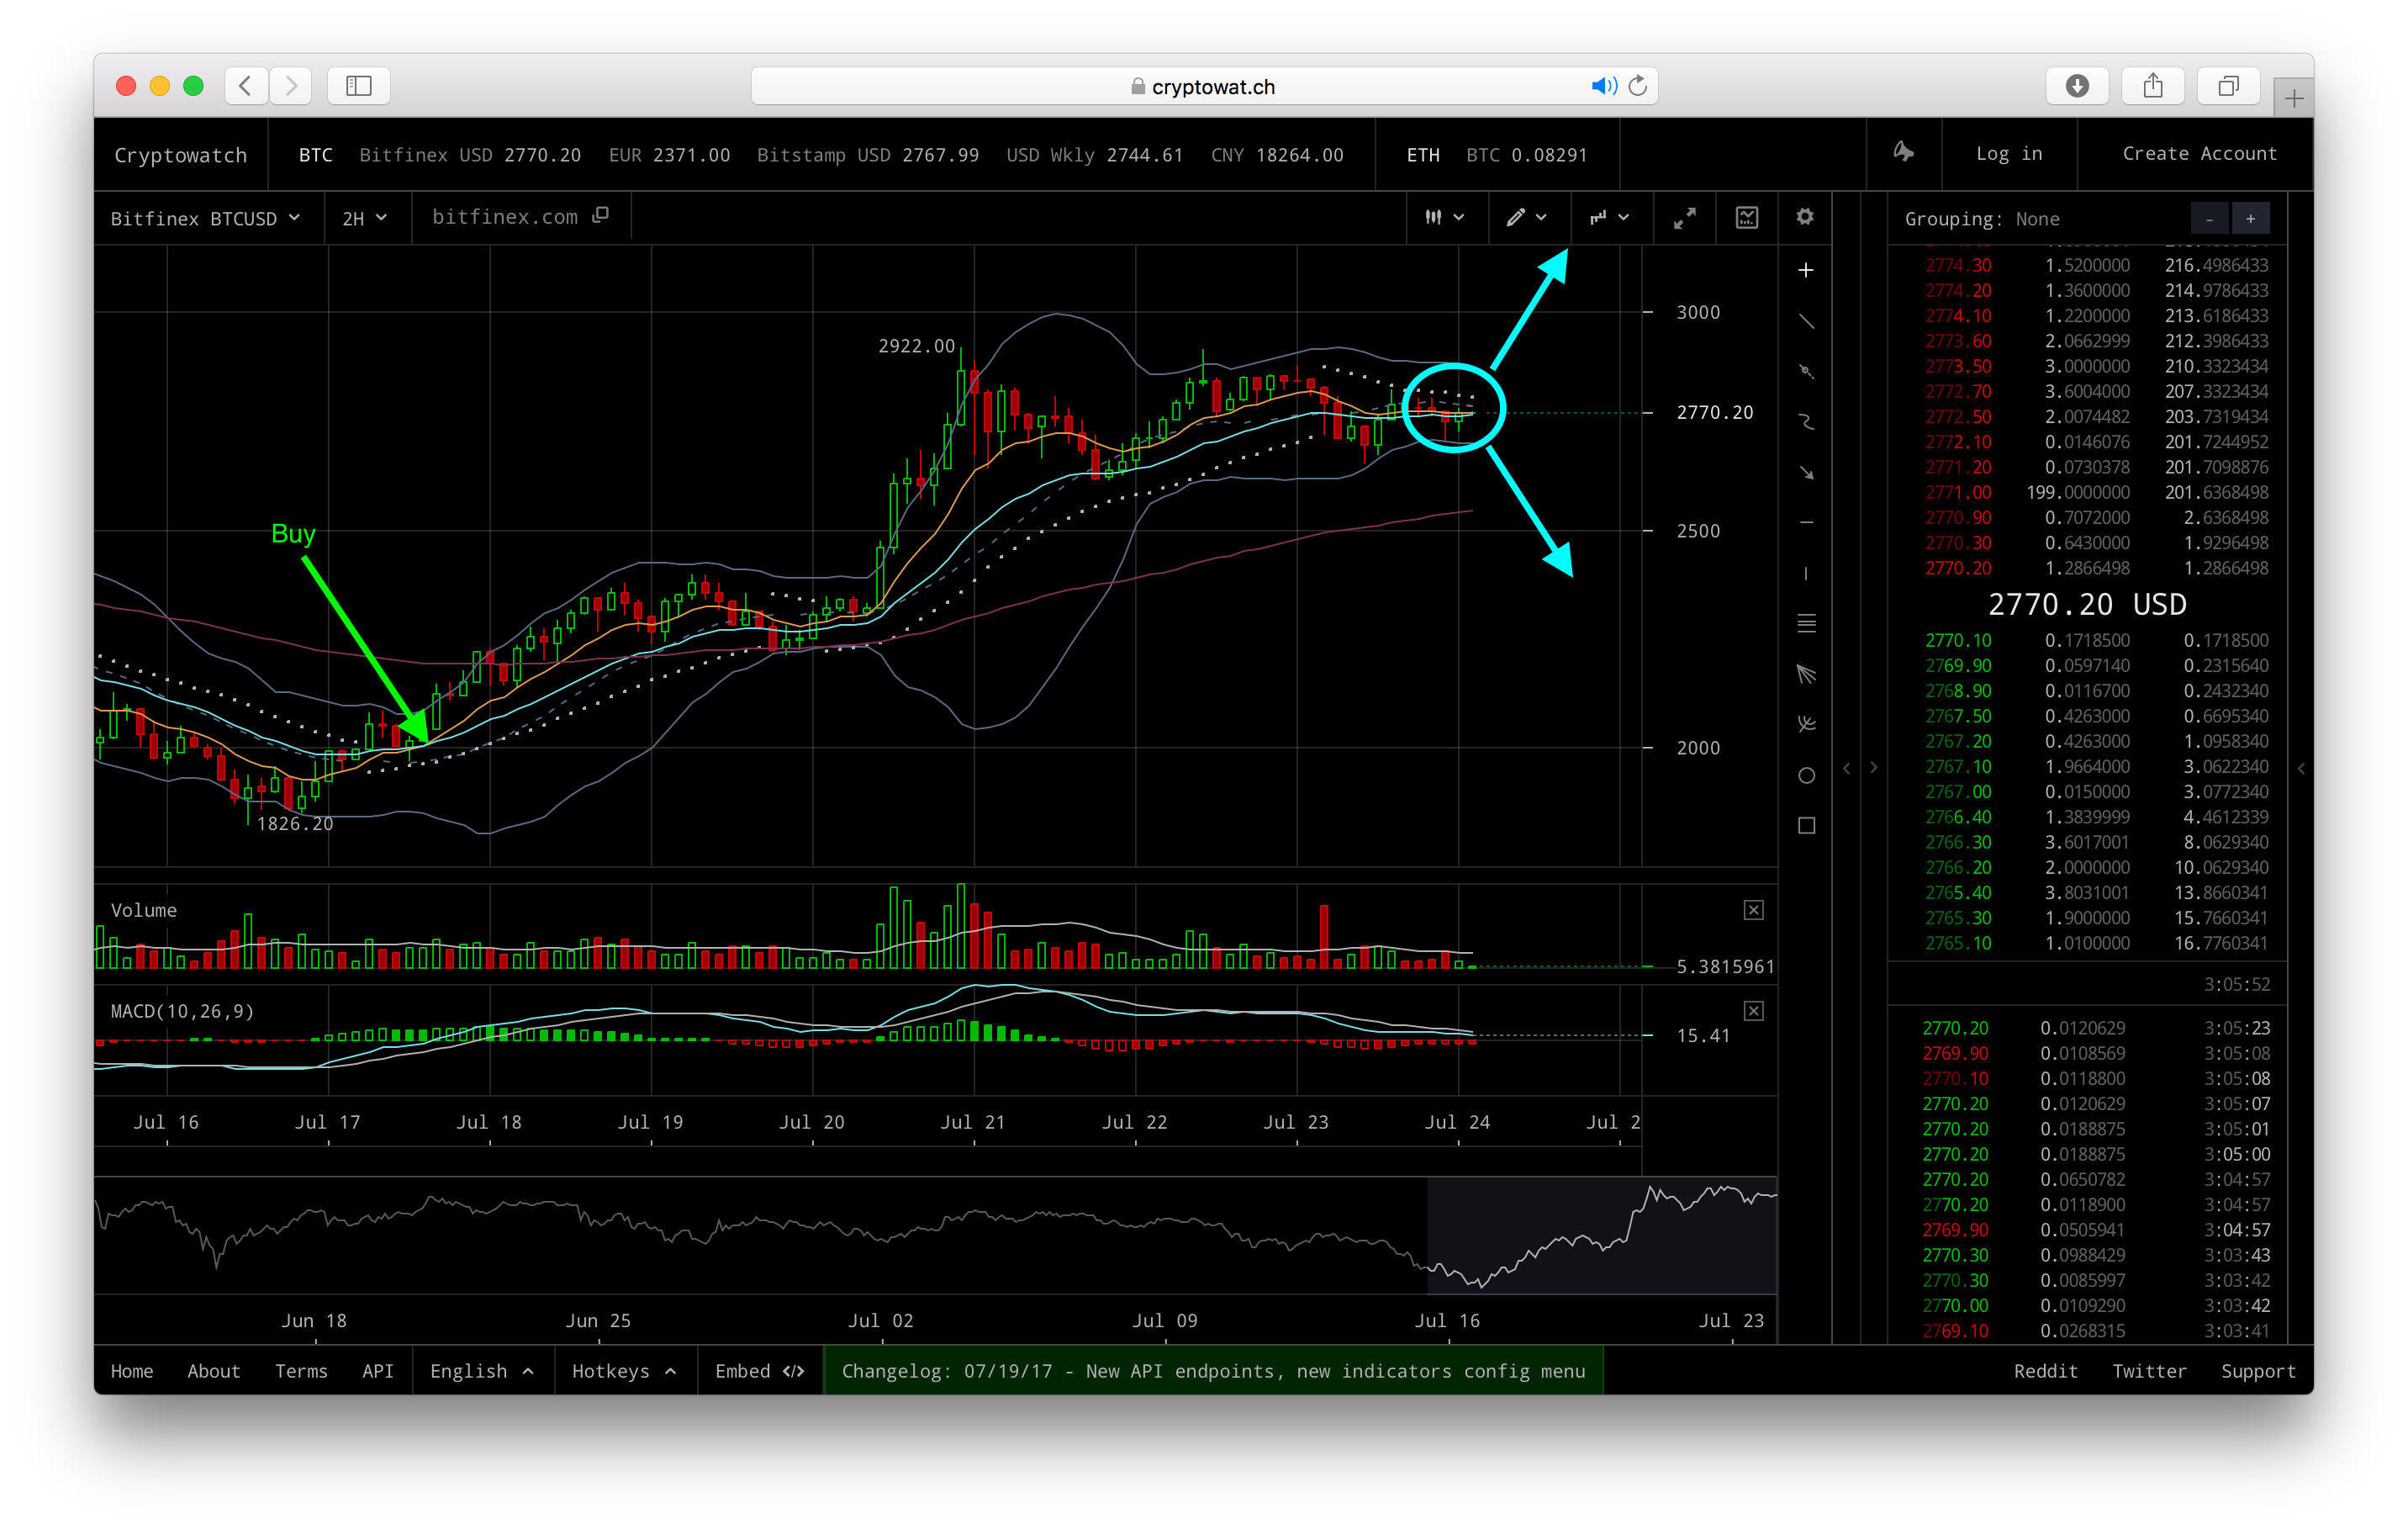
This chart is very interesting because the gold EMA is just hovering above the cyan EMA. If we were to get a cross-over in the negative direction (gold line below cyan line), one might expect some sort of decline in price at least - maybe a 50% retrace (just to give an example). On the other hand, if the EMA lines stay positive (gold line above cyan line), then it's quite likely we might see another spike upwards, instead! Note: I marked the previous cross-over to the positive with the text 'Buy', but this is only in respect to a trading strategy that used this EMA timeframe for buy/sell decisions (and I am not advising use of this to the reader).
(3) I forgot to look for a triangle!
During a consolidation period, a 'triangle pattern' often forms (esp. in bitcoin, in my experience). On the current ethereum chart, it is not so obvious to me. The top line of a triangle is very clear, but the bottom line is less clear to me - if we're looking for a symmetrical shape, that is. Here's an example of one I drew:

As we can see, the top line is very well defined, but I've just randomly picked a single point for the bottom line - so there's not much science involved here :)
If we were to zoom in on this shape, we would see the following:
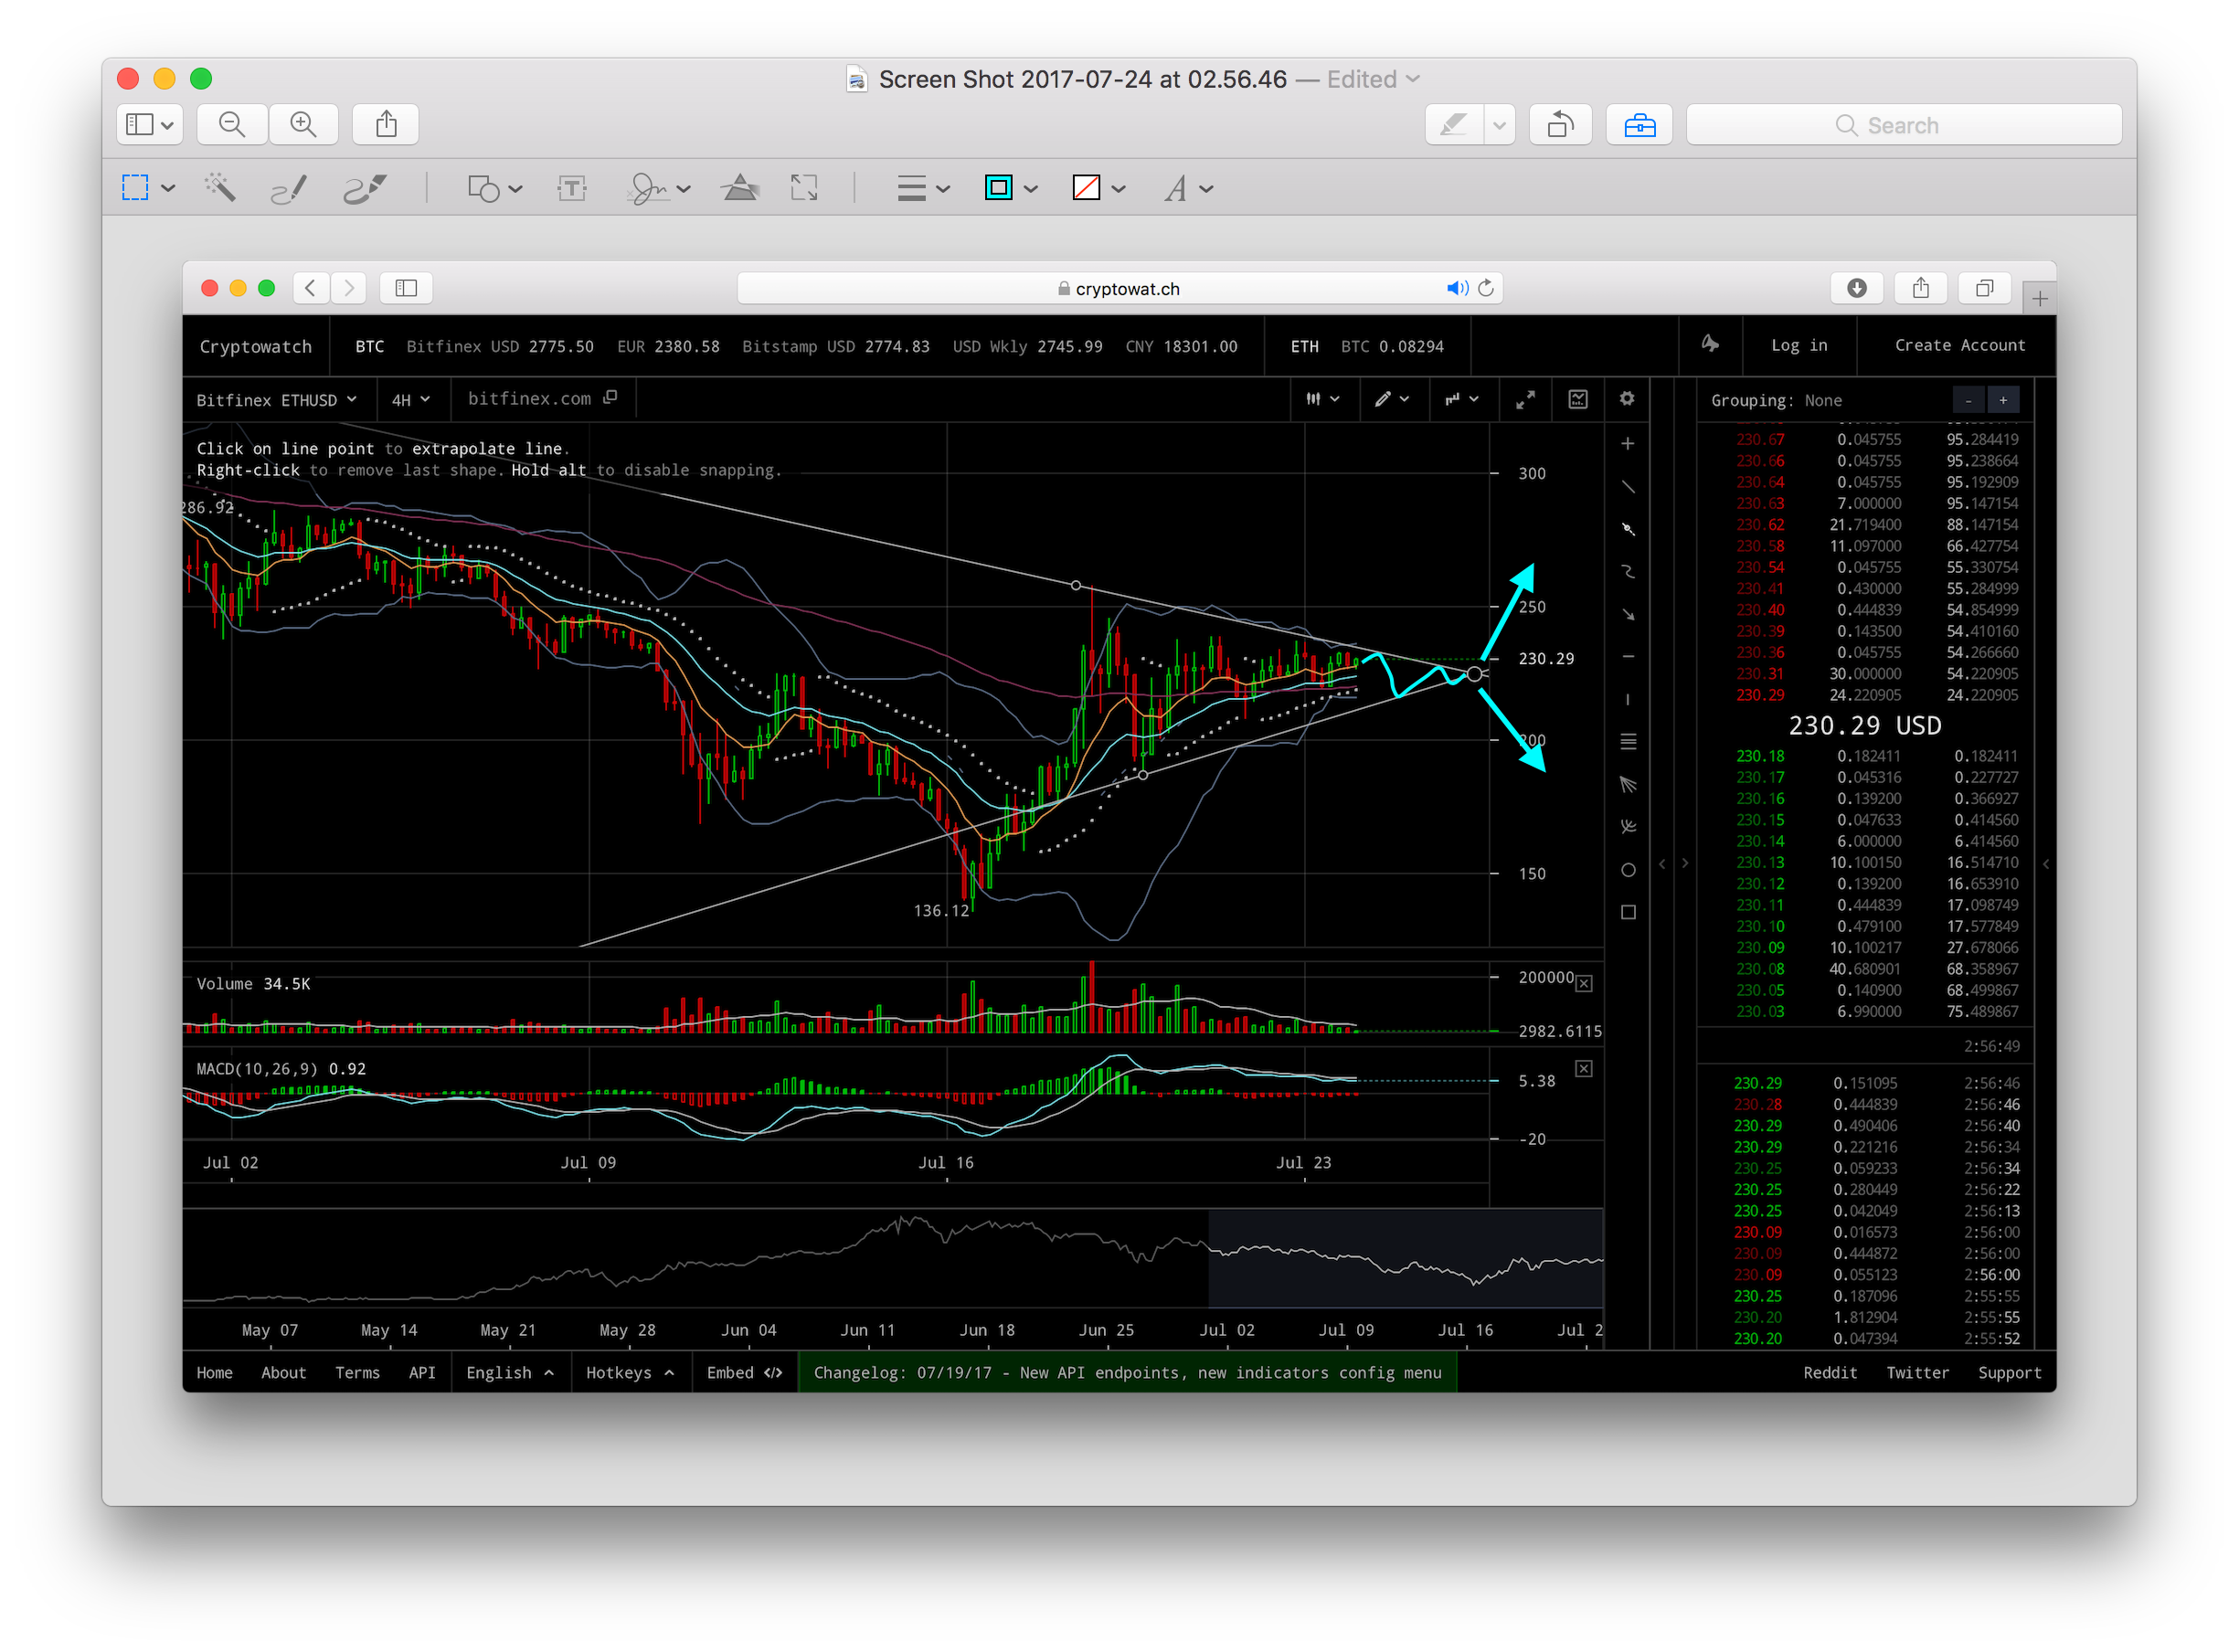
I then randomly drew some zig-zag lines to show what we might typically expect near the end of such a triangle, but in this case there is very little to support this particular pattern, since (as discussed) the bottom line of the triangle has been randomly chosen. Once a triangle nears completion, we often see the price move up or down (but it can continue sideways of course, too!)
(4) Finally, I missed one of the most obvious ways to approach trading in a situation where you might be looking for a break-out to occur. This is simply not hold the asset (ETH in this case), but to wait until the price has broken upwards to a certain level, before buying (i.e., 'buy the breakout'). Of course, if you wait for the price to move higher, then you are reducing your potential gain; but this method has the advantage that if your price target isn't reached for buying, and the price declines instead - then you don't make any loss, and you also don't have worry about if and when to sell. Also, many trading platforms support an automated way to buy if the price rises to reach a specific target, and this is known as a 'stop buy order' (although there are two variants: one which will trigger a 'market order', and one which will trigger a 'limit order' at a designated price).
But what price should one choose to buy at? This is entirely something individual must decide, but here's a couple of examples of places I might think to consider:
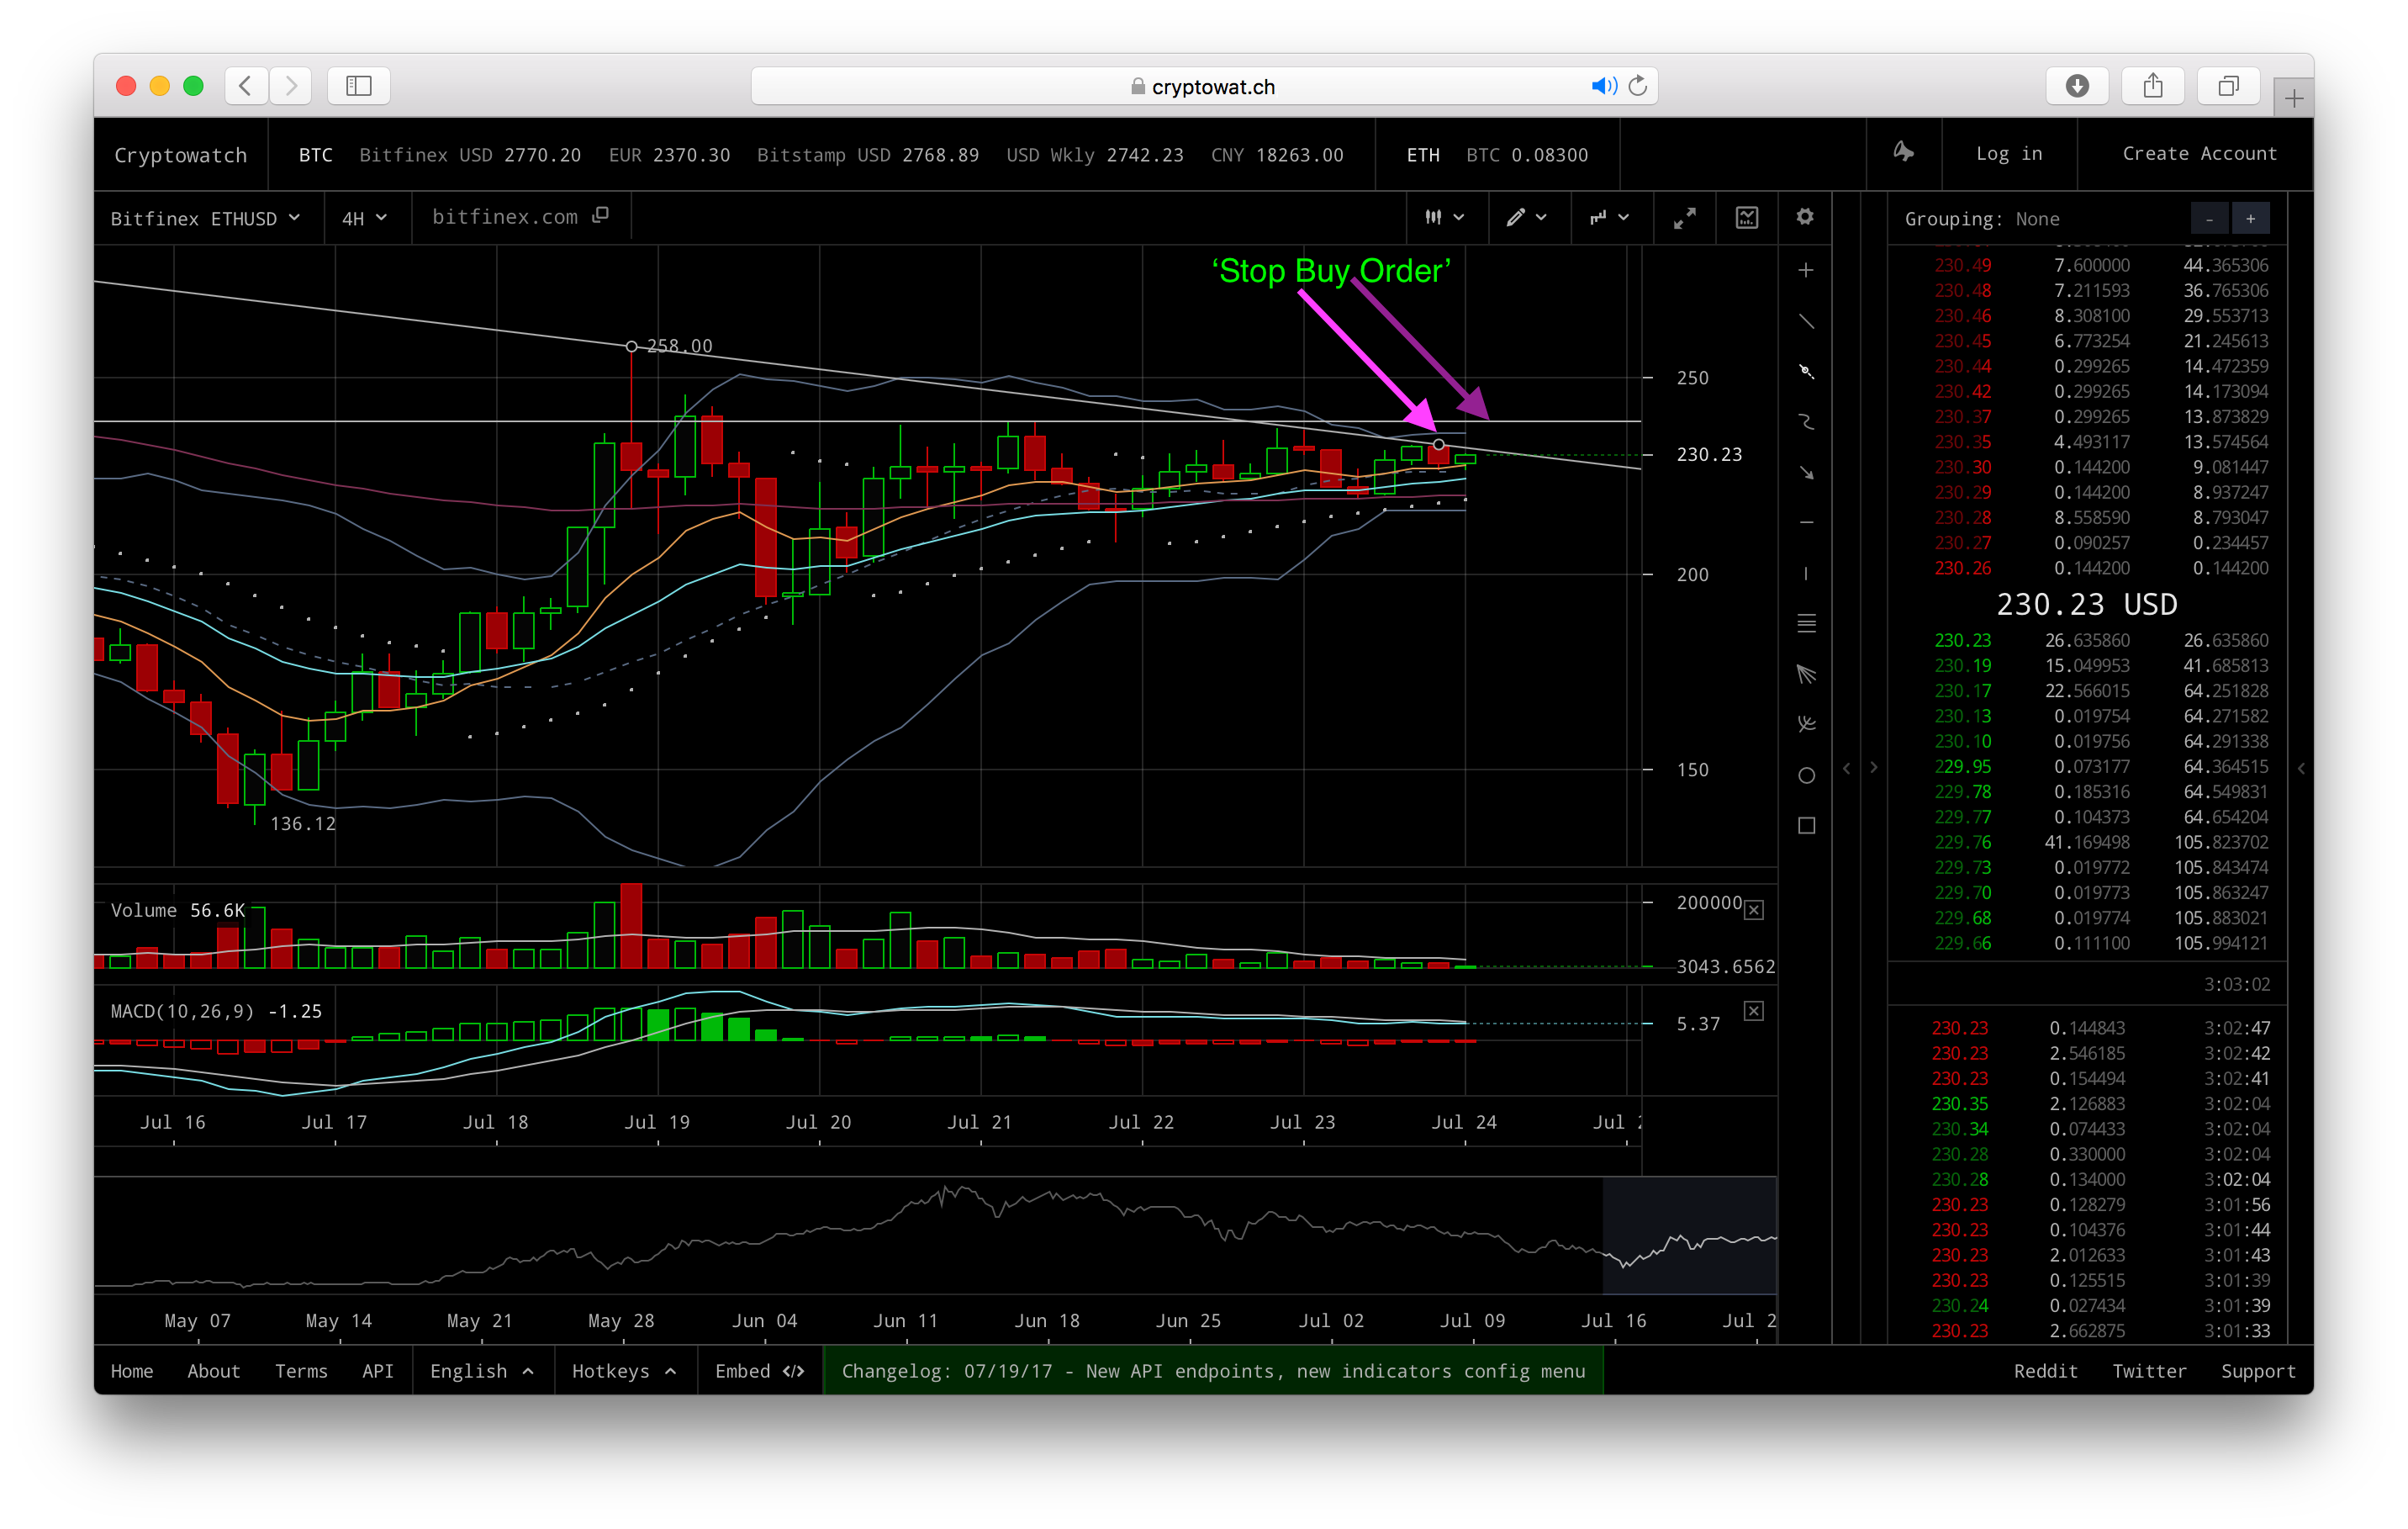
I've marked a light magenta arrow at the top of the b-band for this timeframe. A price point could be chosen slightly above this line for a stop-buy order / manual buy once it reached this point.
I've marked a dark magenta arrow where a horizontal line touches a few of the recent high price points. Again, the price to choose for a stop buy order would be slightly above this level. How far above to place order would be a matter of preference - e.g. $1,$2,$5, or something else. Note: I am not suggesting to the reader to use this approach and/or place stop buy orders at these levels, instead I'm only describing an example of this type of strategy.
Again, please let me know if this you have thoughts on these points/agree/disagree/have suggestions for better technical analysis!
DISCLAIMER: I am not offering trading advice. Any comments in this post are merely things I might consider doing, and I'm not advising the reader to follow any of these potential strategies. I am not advising the reader to either buy or sell Ethereum. The reader must take full responsibility for any trading strategies they use, in regard to anything read in this post.