Steem Analysis
How to lower the churn rate (or increase the retention rate) on Steem ?

Repository
Steem
https://github.com/steemit/steem
Analysis
https://github.com/algo-coder/steem-retention-stats
Table of Contents
- General introduction
- General Statistics about churn / retention rates
- The influence of Apps
- The influence of Tags
- The influence of Powering Up
- The influence of Payouts
- Conclusion
- Tools and requests used (+ Github repository)
General Introduction
First of all, a big thanks to @crokkon for the encouragements and advices he gave me on my latest post and on Discord.
Also a big thanks to @paulag and her article (How to Engage and Retain Users (Backed up with Steemit Data) that gave me the idea to dig deeper on the subject.
This analysis assumes that churn rates on Steem are high (based on @paulag's conclusion) and that some behaviours / initiatives (participating in @abh12345's Curation and Engagement Leagues for example) play a big role in retaining users on the platform.
The average drop-off day for new users (excluding accounts with no activity ever) is the 75th (see @paulag's post) after the creation of the account.
So the question is : What differentiates (on average) a user that leaves at day 75 or before, and a user that stays after that delay ?
I thought of four main explainations : apps, tags, powering up and payouts. We will look at data (one factor after the other) and see if we can determine a clear data gap between users who leave and users who stay. Of course there's a lot of other factors that could come into play, but those are quantifiable and data-friendly, and a lot of more "subjective" factors (Are you alone or did you come on Steem invited by a friend, a spouse ? Were you already a blogger or not ? Are you on a lot of other social medias ? Are you an investor or a content creator ?) are expressed indirectly in these four main explainations.
So we will check on all Steem accounts created before today minus 90 days and see their activity in the first 75 days following the account's creation. If the account is still active (with a post, a vote or an account update) after 75 days (no matter if it's still active today or not), we will classify it as "Active". If not, it will be considered as "Inactive".
An account with no post or comment at all is considered as "Never Active". An account with only activity in the first two days (48 hours) also (little differences with @paulag's classification but necessary for eliminating all the noise possible from the data). "Never Active" accounts are excluded from the analysis.
General Statistics
Active, Inactive and Never Active accounts by date of creation
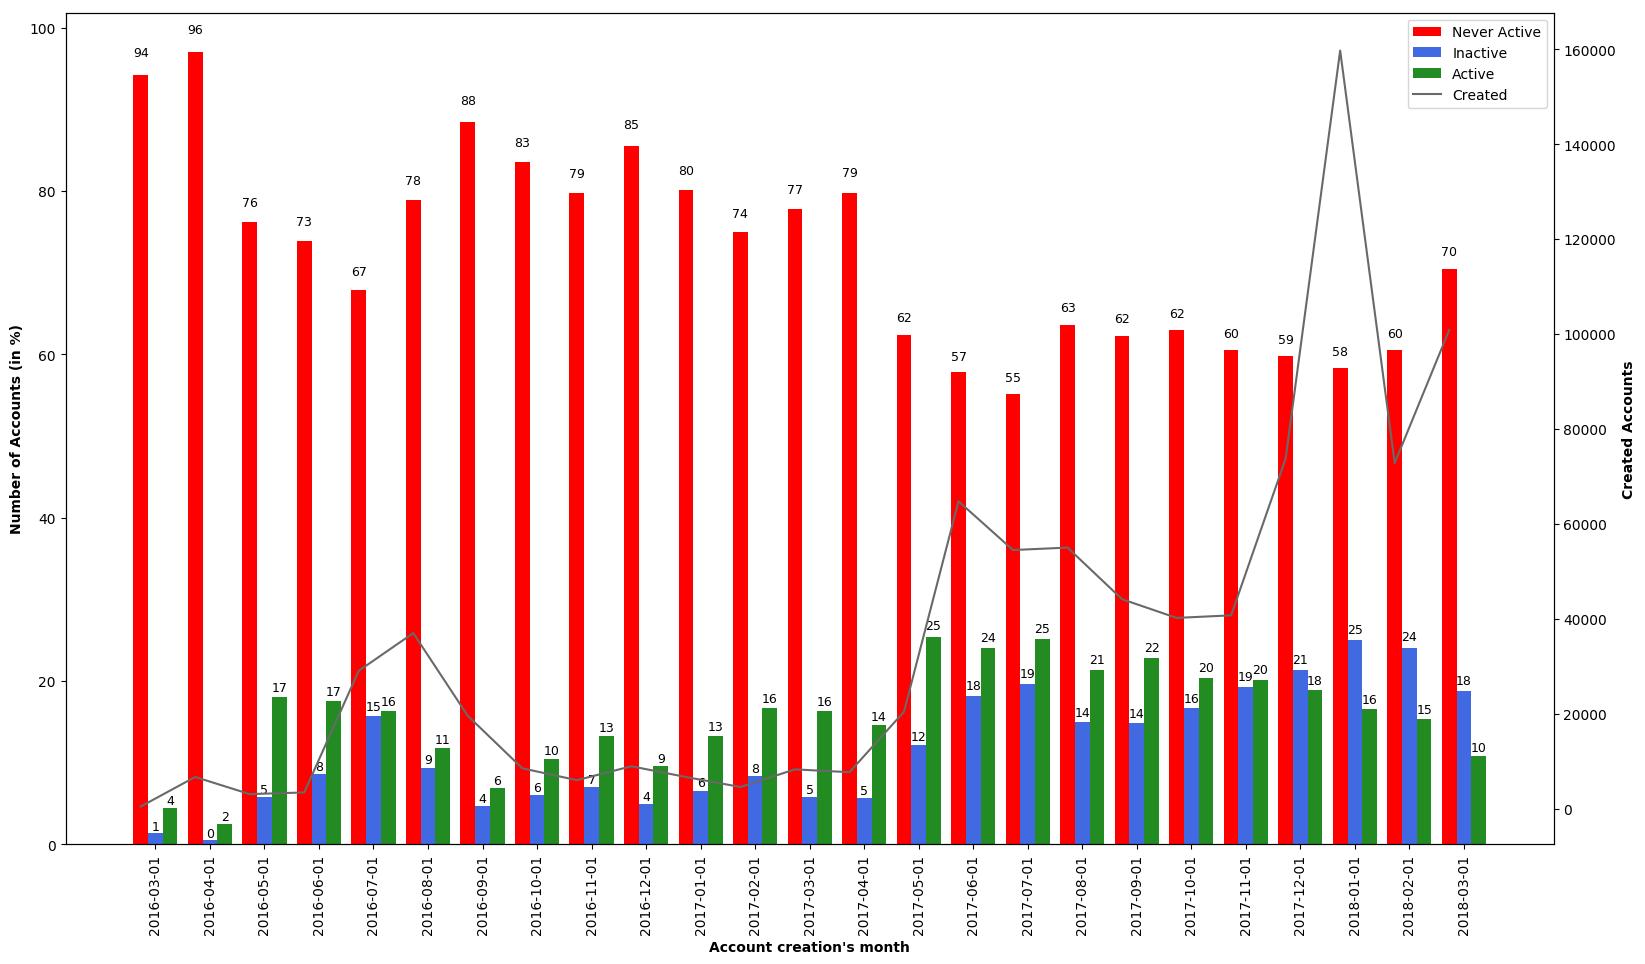
Here we have general statistics about account activity depending on the date of the account's creation. Dates of creation are grouped by months.
All the data in bars are in percentage of the accounts created that month (left y-axis) :
- In red, the "Never Active" accounts (in percentage) that are excluded from our analysis.
- In blue, the "Inactive" accounts, for which the activity stops at day 75 or before.
- In green, the "Active" accounts, who still show some activity after day 75.
On the secondary y-axis (on the right), the number of accounts created each month (the grey line).
Statistics for all 878 176 accounts:
64.34 % (565 049) are classified "Never Active",
18.14 % (159 308) are classified "Inactive",
17.52 % (153 869) are classified "Active."
Observations
What could explain so many "Never Active" accounts ?
First of all, the first months of Steem are exceptional with PoW and its system where multiple accounts were needed (read this somewhere, I'm not sure as I wasn't there). So a lot of accounts then were created for the sole purpose of mining. But we also see that it concerns a really low number of accounts.
For me (personal opinion), I think that the main cause of these "Never Active" accounts is the time it takes to validate an account. People nowadays want instant results, and by the time they receive the e-mail to definitively activate their Steem account and get the password, they already forgot about their Steem sign-up.
I don't have access to the data, but it would be really nice to compare the mean time of account validation (by month of creation) to the percentage of "Never active" accounts.
And for sure, the STEEM / USD price has an influence on this percentage too.
Accounts dropping off by day of presence

Here we see the drop-off day (x-axis) of the Inactive accounts, and the percentage of all Inactive accounts it represents (blue bars, left y-axis).
On the secondary y-axis (right), we see the percentage of Inactive accounts that already dropped off up until and including this day. So at day 75 we are at 100 % (all inactive accounts have dropped off). Remember, if an account drops off at day 76, it is considered active. By checking the intersection between a day, and the right (secondary) y-axis you can determine what percentage of Inactive accounts have dropped off before or at that number of days.
From this graph, we see that approximatively 62 % of all Inactive accounts have dropped off before or at day 30. So the most critical period for retaining new users is the first month.
After day 30, drop-off rate per day more or less stabilize. So we can assume that after that delay, we are confronted to a more structural churn rate. The next step would be to compare this residual churn rate with other social media platforms to see how does Steem compare with them.
We have a really big churn rate in the first few days. Maybe some people, reminded they signed up to Steem a week or two ago by the validating account e-mail, come to see what it is all about, post something or comment somewhere and then never come back.
The influence of Apps
Apps Retention Rates

How to read this graph ?
Here we see the influence on the apps used by the user on the retention rate. A score of a 100 means the application has no influence (And a 100 is the score of all apps). A score over a 100 means the application has a positive influence.
The calculation formula of the Retention Rate is as follows:
Calculating the Retention Rate (RR) of an app (or a tag)
First we define a ratio of activity (RA) for this app / tag with the following calculus:
Ratio of Activity (RA) = Percentage of accounts active (PAC) that used at least once this app / Percentage of accounts inactive (PAI) that used at least once this app.
And then adjust it with the global ratio of inactivity (GRI).
To be clearer, let's take an imaginary example :
For a given app, 1 000 users used it, 800 are classified active, 200 inactive.
This app has a percentage of accounts active (PAC) of 80 % (800 / 1000) and a percentage of inactive accounts (PAI) of 20 % (200 / 1000).
So its ratio of activity (RA) is 80 / 20 = 4 = 400 %
To explain this in words, let's say that if a user used this app, he has 4 times more chance to be active rather than inactive. But we can't stop there, because we need to adjust that result with the global ratio of inactivity (GRI).
For the adjustment with the global ratio of inactivity (GRI), let's explore three possibilites (taking the extremes and the middle ground) to show how the formula works :
Case n°1 - We have a global ratio of inactivity (GRI) of 10, meaning that (fictious numbers) x different active users used a mean of y apps (with x.y = 1 000) and at the same time k different inactive users used a mean of l apps (with k.l = 10 000). In this case, there's a lot more inactive users - approximatilvely 10 times - than active users (or we could also say that there are the same numbers of active and inactive users, but that inactive ones used a mean of 10 different apps, whereas active users used a mean of only 1 app, but let's suppose it's not the case for the sake of the analysis).
Case n°2 - We have a global ratio of inactivity (GRI) of 0.25 (x.y = 1 000 / k.l = 250), so there's 4 times more active users than inactive users).
Case n°3 - We have a global ratio of inactivity (GRI) of 0.1 (x.y = 1 000 / k.l = 100).
In our example, for this three possibilities, the final results will be
In the first case : the retention rate would be : 80 (PAC) / 20 (PAI) = 4 (RA) * 10 (GRI) = 40 * 100 = 4 000 % (RR)
In the second case : the retention rate would be 80 (PAC) / 20 (PAI) = 4 (RA) * 0.25 (GRI) = 1 * 100 = 100 % (RR)
In the third case : the retention rate would be 80 (PAC) / 20 (PAI) = 4 (RA) * 0.1 (GRI) = 0.4 * 100 = 40 % (RR)
What does it tell us ?
First case : Great retention rate (80 % active for this app / tag) when there are a lot of inactive users in general (10 times more than active) : the retention rate is 4 000 %, meaning that the app is 40 times better at retaining users than the mean of all apps.
Second case : No retention nor churn, 80 % active for the app, but same ratio on the global scale : the retention rate is 100 %, meaning the app has no influence on retaining users.
Third case : Bad retention rate (80 % active for the app but more than 9 accounts out of 10 are active) : 40 %, we could say that the app scares users away.
The most interesting (as the number of accounts using the apps are really different) is to interpret it in a relative way. Steemit being the main app used, it's normal that most inactive accounts only posted once with Steemit, and never tried other apps, or forgot about Steem altogether.
But a relative approach can tell us a lot about the potential of apps for improving the retention rates.
Let's take the two most used apps after Steemit:
1 -> Busy. A user that posted at least once with #busy is 372 / 84 = 4.42 times more likely to still be active after 75 days compared to a user that posted at least once with #steemit.
2 -> eSteem. A user that posted at least once with #esteem is 161 / 84 = 1.91 times more likely to still be active after 75 days compared to a user that posted at least once with #steemit.
Of course, some accounts posted with #busy and #steemit, being classified as active and inactive in both apps. But the gap between the Retention Rates (even if the formula can't be perfect because of this multi-apps users) clearly shows that the app used by the user has a great influence on the duration of his journey on the Steem blockchain.
Counter arguments
Of course, we can say that a lot of early dropping-off users are the main cause of the low retention rate of the Steemit app, because they have a great chance of having used only Steemit for interacting with the Steem Blockchain.
-> Yes, but that would be minimizing the importance of the User Interface, and as "Never Active" users aren't taken into account, it means that users came on #steemit, posted and then left, so, even if it's with no certainty, maybe Steemit was a factor in their decision of leaving the platform.
We can also say that people who took the time and made the efforts to discover other apps already decided in staying.
-> That's a possibility, but the only way to know would be to have a better "default" interface and then compare results with the retention rates of the current option that is Steemit as the default interface.
The influence of Tags
Tags Retention Rates (TOP 1 -> 50 most used tags)

Tags Retention Rates (TOP 51 -> 100 most used tags)
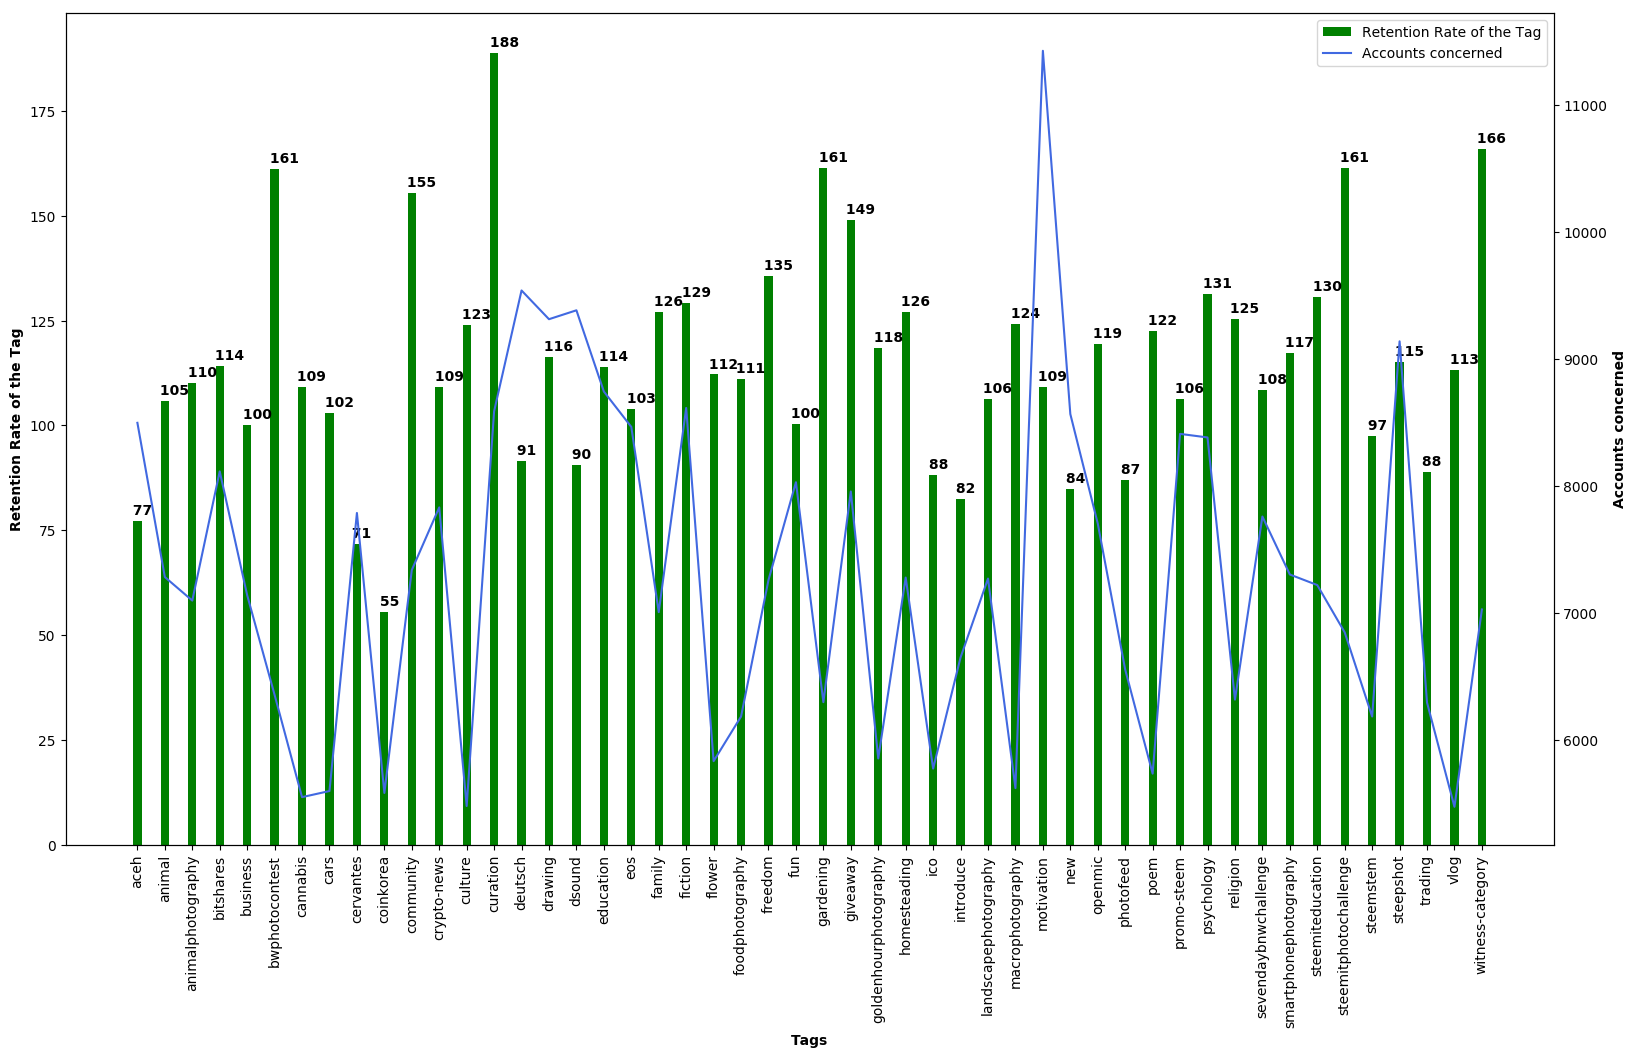
These graphs must be read the same way as the Apps one (it is using the same formula for calculating the Retention Rate). These statistics only take into account the main tags of posts.
The influence of tags is not as clear as the influence of applications. But there are still some useful informations to be extracted from this.
First we see that crypto-currency related tags have low retention rates: #bitcoin with 51, #cryptocurrency with 58, #crypto with 76.
Whereas casual tags have more success in retaining users : #history with 112, #philosophy with 128, #writing with 108, #culture with 123, #family with 126, #fiction with 129. All the authors posting at least once with one of these tags is at least 2 times more likely to still be active after 75 days than a user that posted with #bitcoin or #cryptocurrency.
But the most retaining tags are:
- The ones concerning Steem's technical aspects : #community with 155, #curation with 188, #witness-category with 166.
- The ones about contests (meaning the user began organizing contests / entering in contests during his first 75 days): #colorchallenge with 105, #contest with 122, #bwphotocontest with 161, #giveaway with 149, #steemitphotochallenge with 161.
As I already said, the influence of tags doesn't seem to be as important as the influence of apps. But we clearly see some big trends here. Even if Steem is viewed as a crypto-related social media, in fact that's the field where the churn rate is the highest.
Whereas traditional subject areas have a much better retention rate.
The influence of Powering Up
STEEM Powered Up by Active / Inactive users

Here, there is no debate possible. Powering Up is an evident factor in retaining users.
A user who has powered up in his first 75 days is 4.51 times more likely to still be active after 75 days compared to a user who didn't power up.
If the influence of powering up is low (4.51 times is good, but still seems low as we're talking about people investing in Steem), we can object that the amount of Steem powered up should have been taken into account.
When looking at the figure, if we see that in terms of number of accounts we have 32 259 active accounts who powered up / 7 155 inactive accounts who powered up = 4.51, in terms of amount invested, the ratio would be more like 25 million / 140 thousands = 178, so the amount invested seems much more relevant than only the criteria of "Powering up".
Erratum : An error has crept in the numbers. Correction put the new ratio to 4.51 instead of 5.75. So no modification in the conclusion or anything. The Github has also been corrected.
The influence of Payouts
Payouts of Active / Inactive users

Here we see that Active users have received (in mean) a max payout of 1.773 $ in their first 75 days, whereas Inactive users received a max payout of 0.238 $ in the same period.
Active users received approximatively double payouts compared to inactive users.
Receiving a "big" payout during the first 75 days of arriving to Steem seems to be a clear and important factor on retention.
Counter arguments
Maybe the gap in all payouts are due to users using bid-bots or upvote-bots. I didn't take this information into account. If it's the case (that most max payouts from active users are due to the use of bid bots) then it would only mean (as the powering up aspect) that investing in Steem is a clear factor influencing the retention rate.
Conclusion
Time to draw some conclusions.
Every factor we studied has a clear influence on the retention rates, so how to act on it ?
For the app, it's clear that Steemit.com might be a factor in the high churn rate. Making the interface more user-friendly may have a big impact on the retention rate.
For the tags, we see the importance of community and carefully choosing the tags used. It's the difference between some and no visibility for a new user, hence having a strong impact on the retention rate. It also tells us that some aspects of Steem (if discovered by the user), especially the technical ones, have a positive influence on the retention rate (witnesses, curation, etc.).
Powering up clearly shows that people who invest in Steem are here to stay. That's the most trivial conclusion, as Powering Down takes 13 weeks...
Payouts also show that real tangible results on a user's post encourage him to stay.
How to correct the course ? (Personal opinions)
- Steemit Inc. must put UX / UI as its number one priority for its developers (I know that's not the current priority) because it's clearly an important lever to retain users on the platform.
- Steemit Inc. should delegate more of its Steem Power to community-driven accounts, as they're the ones having a big influence on retention rates. It should also explain better to new users (maybe some tutorials, a clearer FAQ, some "pinned" posts) some technical aspects of Steem, as it seems to be a clear factor in retention once it's understood.
- Instead of delegating Steem Power to new accounts (or maybe delegate less), it would be better used in "moderating" or "community" accounts that would upvote newcomers' posts. People don't realize that the 15 SP delegation from @steemit is a big amount. They seem, on the other hand, really responsive (in terms of retention) when being "correctly" rewarded soon in their Steem journey.
Tools and requests used
All data was extracted with @arcange's SteemSQL.
All data manipulation was made with Python.
All scripts used are in this Github repository :
https://github.com/algo-coder/steem-retention-stats
General information about the files in the repository
The script extraction.py takes approximatively 360 minutes (6 hours) to fully execute, its role is to retrieve the raw data from SteemSQL, and then transform it into what will be needed for the next script, and storing it in a local MySQL Databse. Progress information are displayed every 5 seconds in the console.
The script stats.py takes approximatively 10 minutes to run, it will put some stats in the console and generate 6 graphs that will be saved in the directory the script is in.
The file table.sql contains the SQL instructions for the creation of the table needed for the local MySQL database.