Repo
https://github.com/pzhaonet/steemr
'steemr' is an open source R package for playing with Steem data in R environment. It is used to download, post process, analyze, and visualize Steem data on the basis of the powerful statistic power of R.
New Features
What features did I add?
New functions were added to the steemr pakcage, which now can retrieve the account data and the comment data and plot diagrams automatically.
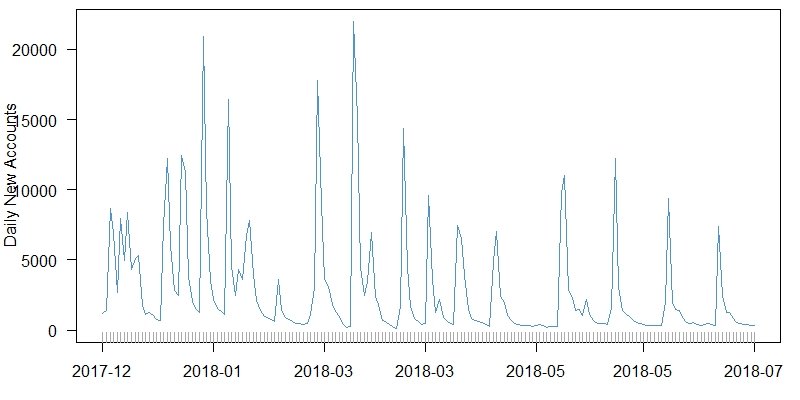
gaccounts()retrieves the account data from the server, makes a summary of the account data, and plots a time series of the daily new accounts automatically.
Here is an example, showing the daily new steem accounts in a diagram and a table from 2018/01/01 to 2018/07/01 produced by gaccounts() :

          date  Freq
1   2017-12-31  1161
2   2018-01-01  1397
3   2018-01-02  8638
4   2018-01-03  6901
5   2018-01-04  2660
6   2018-01-05  7979
7   2018-01-06  4940
8   2018-01-07  8391
9   2018-01-08  4340
10  2018-01-09  5122
...
178 2018-06-26   545
179 2018-06-27   460
180 2018-06-28   405
181 2018-06-29   376
182 2018-06-30   353
183 2018-07-01   321
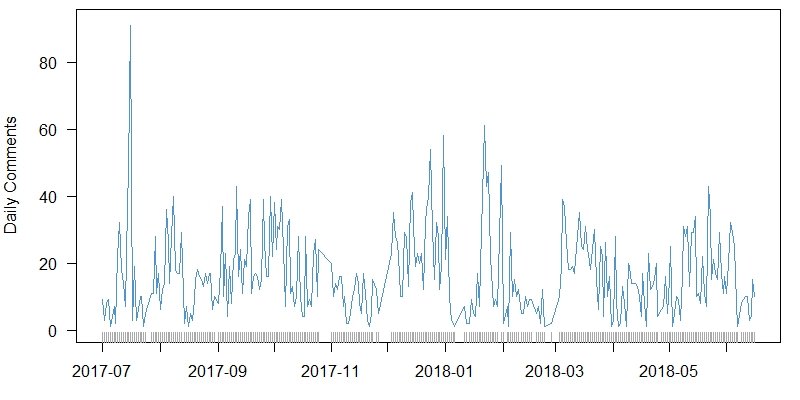
gcomments()retrieves the comment data from the server, makes a summary of the comment data, and plots a time series of the daily comments of a given ID automatically.
Here is an example , showing the daily comments (posts and replies) of my own in a diagram and a table produced by gcomments() :

        date Freq
1 2017-07-17    9
2 2017-07-18    3
3 2017-07-19    8
4 2017-07-20    9
5 2017-07-21    1
6 2017-07-22    4
...
311 2018-06-27   10
312 2018-06-28   10
313 2018-06-29    3
314 2018-06-30    4
315 2018-07-01   15
316 2018-07-02   10
These main functions are supported by some other functions:
adailyf(), which produces a daily summary and a daily diagram from a give data set,pdate()andxatf(), which were tailored to plot time series of Steem data.
The old functions were renamed for better understanding. The meaning of the beginning letter in a function name:
- a: analysis
- g: get data
- p: plot a diagram
The script files were re-organized, according to the functions.
Some minor literal changes and small bugs were fixed as well.
How did I implement them?
I split the former 'R/steemr.R' into 'R/plothour.r', 'R/analysis.r', and 'R/get.r'.
I created new scripts 'R/internal.r' for internal used function, 'R/plot.r' for plotting functions, and 'R/import.r' for importing some external packages
I added the new functions into 'R/plot.r', 'R/analysis.r' and 'R/get.r'
Links to relevant lines in the code on GitHub can be found mainly in my latest commits (click to see the details):
- v0.0.8. Re-organized. New functions..
- bugs fixed. code improvement.
- minor bugs fixed: lattice::
- a small format fixed
- a minor bug fixed
