My last post where I suggested a series data science/statistics related post was met with a lot of enthusiasm. Our first practical task is going to be to install R and RStudio.
R is free open-source statistics software. It was originally developed at the University of Auckland by Ross Ihaka and Robert Gentleman as an open source alternative to S/S-plus. Although it was originally used mainly in universities/academia, it has become popular in commercial realms due to the wide range of useful packages and flexibility that it offers (and probably also the fact that it is free - many of the commercial software products are obscenely expensive). I had the good fortune to start my studies at The University of Auckland the year they introduced R to undergraduates, so I have been using it for 21 years.

In the guide we are going to be installing the actual R programme and also a nice interface known as RStudio.
Installing R
From https://cloud.r-project.org/ choose your operating system (Mac/Linux/Windows)
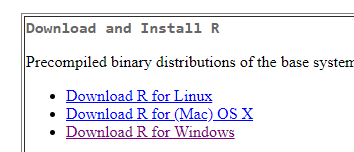
For Mac and Unix choose the appropriate package. For Windows click on "install R for the first time" and then the download link at the top of the page (right now it says Download R 3.5.1 for Windows but the version number will change over time). Run the installer. For now all of the default choices will be fine. You now have the basic R console installed. If you run it, it will look something like this:
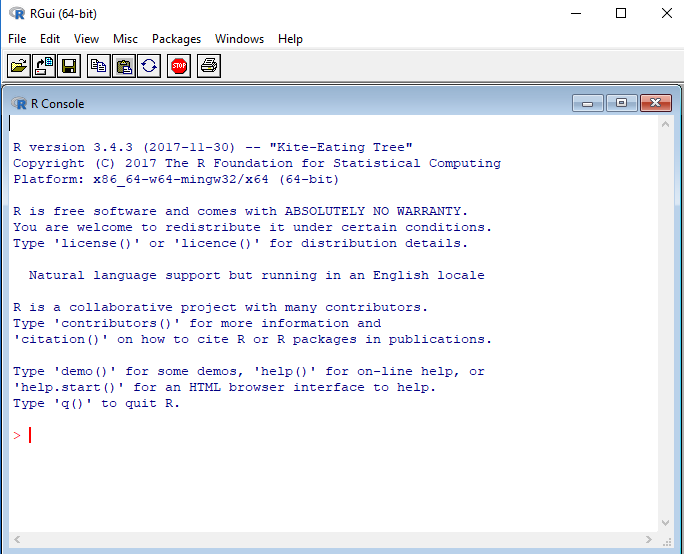
Note: R is a command line driven software. You need to type commands for it to do things which means it does have a learning curve.
Installing RStudio
From https://www.rstudio.com/products/rstudio/download/#download click on the Installer that matches your computer (R/Mac/Linux). Again the default options for installation should be fine. You now have a nice interface for R.
Getting Started
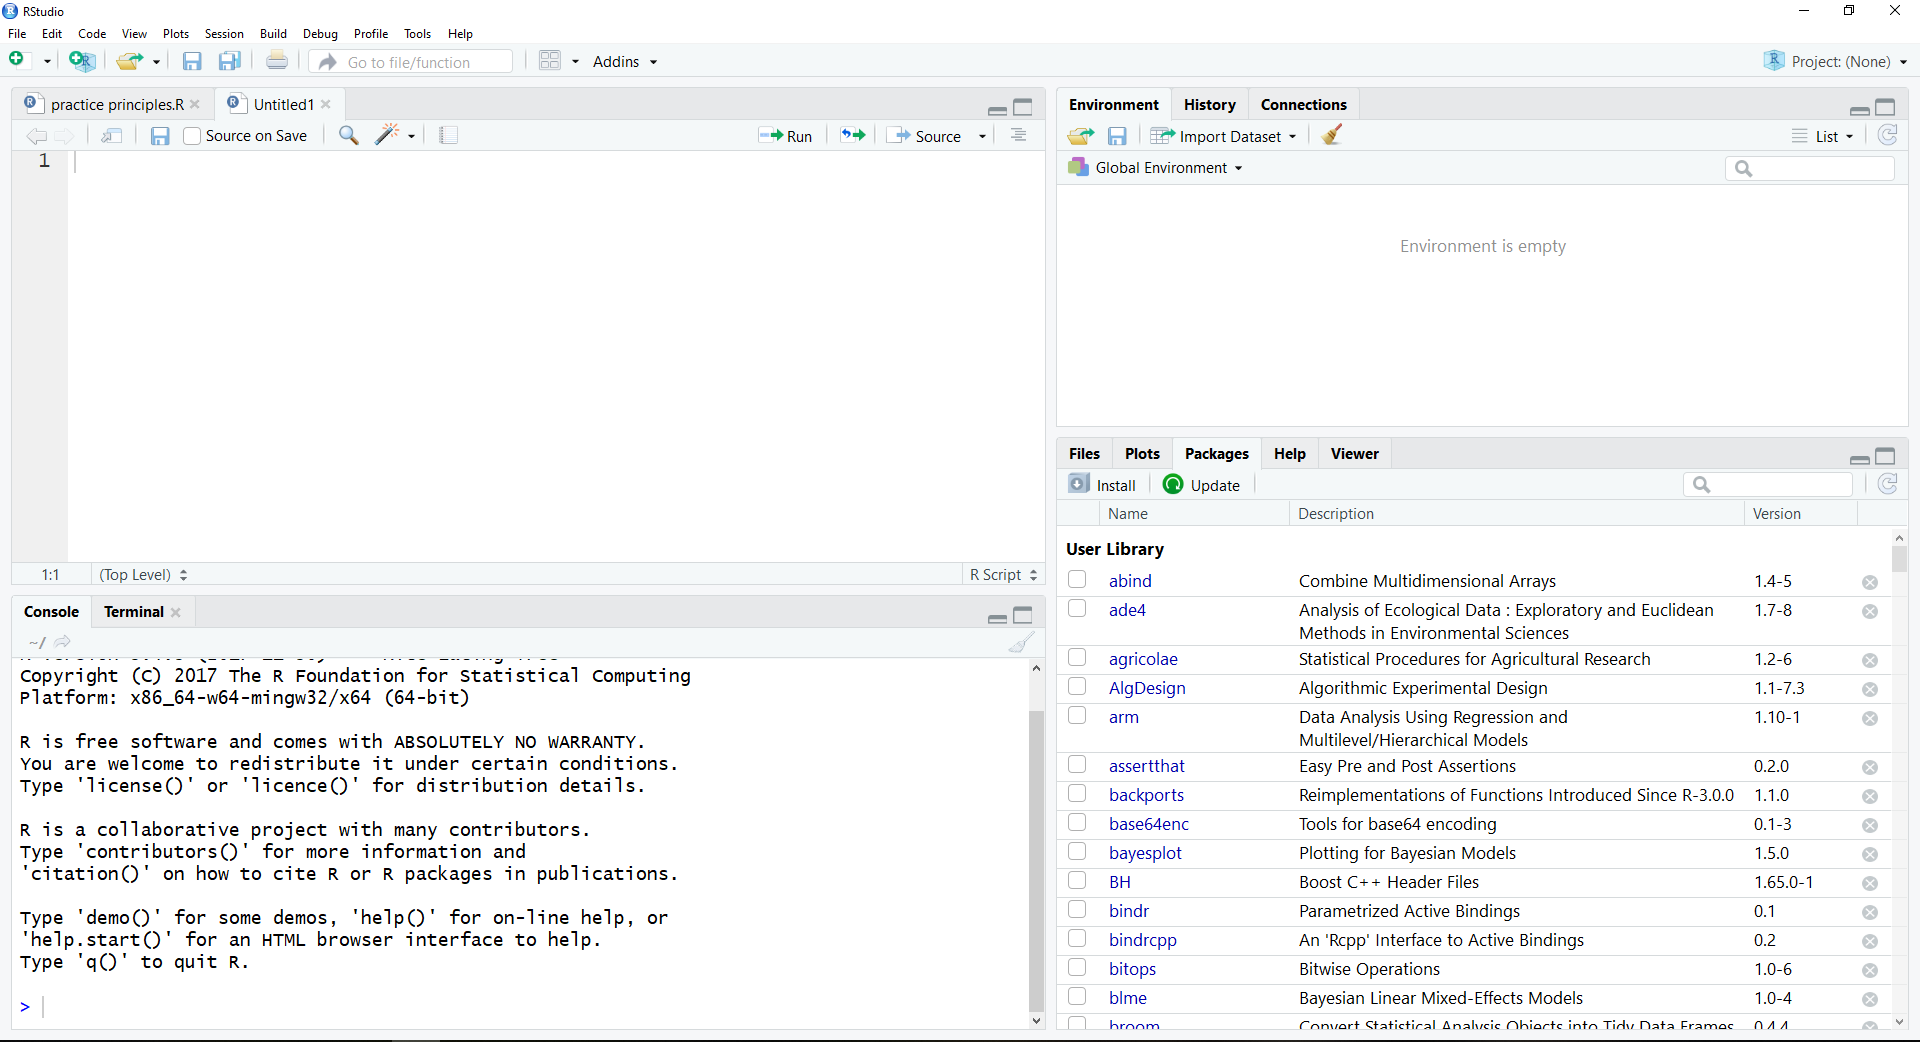
RStudio splits the screen into four sections. The top left is a notepad where you type and save your code. It will colour code R functions and provide other basic navigation. The code gets run in console in the bottom left (you send code to the console with the Run or Source buttons (one line vs all the code)). The top right has a couple of tabs but the environment one is the most useful as it shows your current variables/data. The bottom right has tabs for plots, help, and add-on packages.
In future posts we will look at real code and analysis but for today we will do something akin to a "Hello World". In the script space in the top right type:
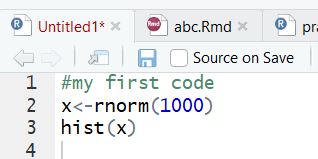
Click on Source or select all the lines and click Run (or Ctrl+Enter) or click Run on each line to run line by line. Anything with a # in front of it is treated as a comment and not run by R (notice it is also coloured in green). In the first line of actual code (line 2) we make a vector named x that contains 1000 random numbers drawn from a normal distribution with a mean of zero and a standard deviation of one. The second line draws a histogram of the data stored in x (in the future we will learn how to make nicer looking graphs).
If you like you can also save your code. It will save as a .R file but this is effectively just plain text.
I hope this has been helpful. Stay following for more on statistics, data science, and R.