Characterization of accounts and different states in the Steem/Steemit ecosystem based on the analysis of the evolution of rewards differentiated by tokens.
Link to the github repository
https://github.com/steemit/steem
1. INTRODUCTION
A wallet as a plumbing system
The following diagram visually summarizes the operating structure of a wallet to receive, store, convert and transfer tokens. In this analysis I will focus on the token flows from the rewards pool by comparing the evolution of the proportions of the different types of available tokens.
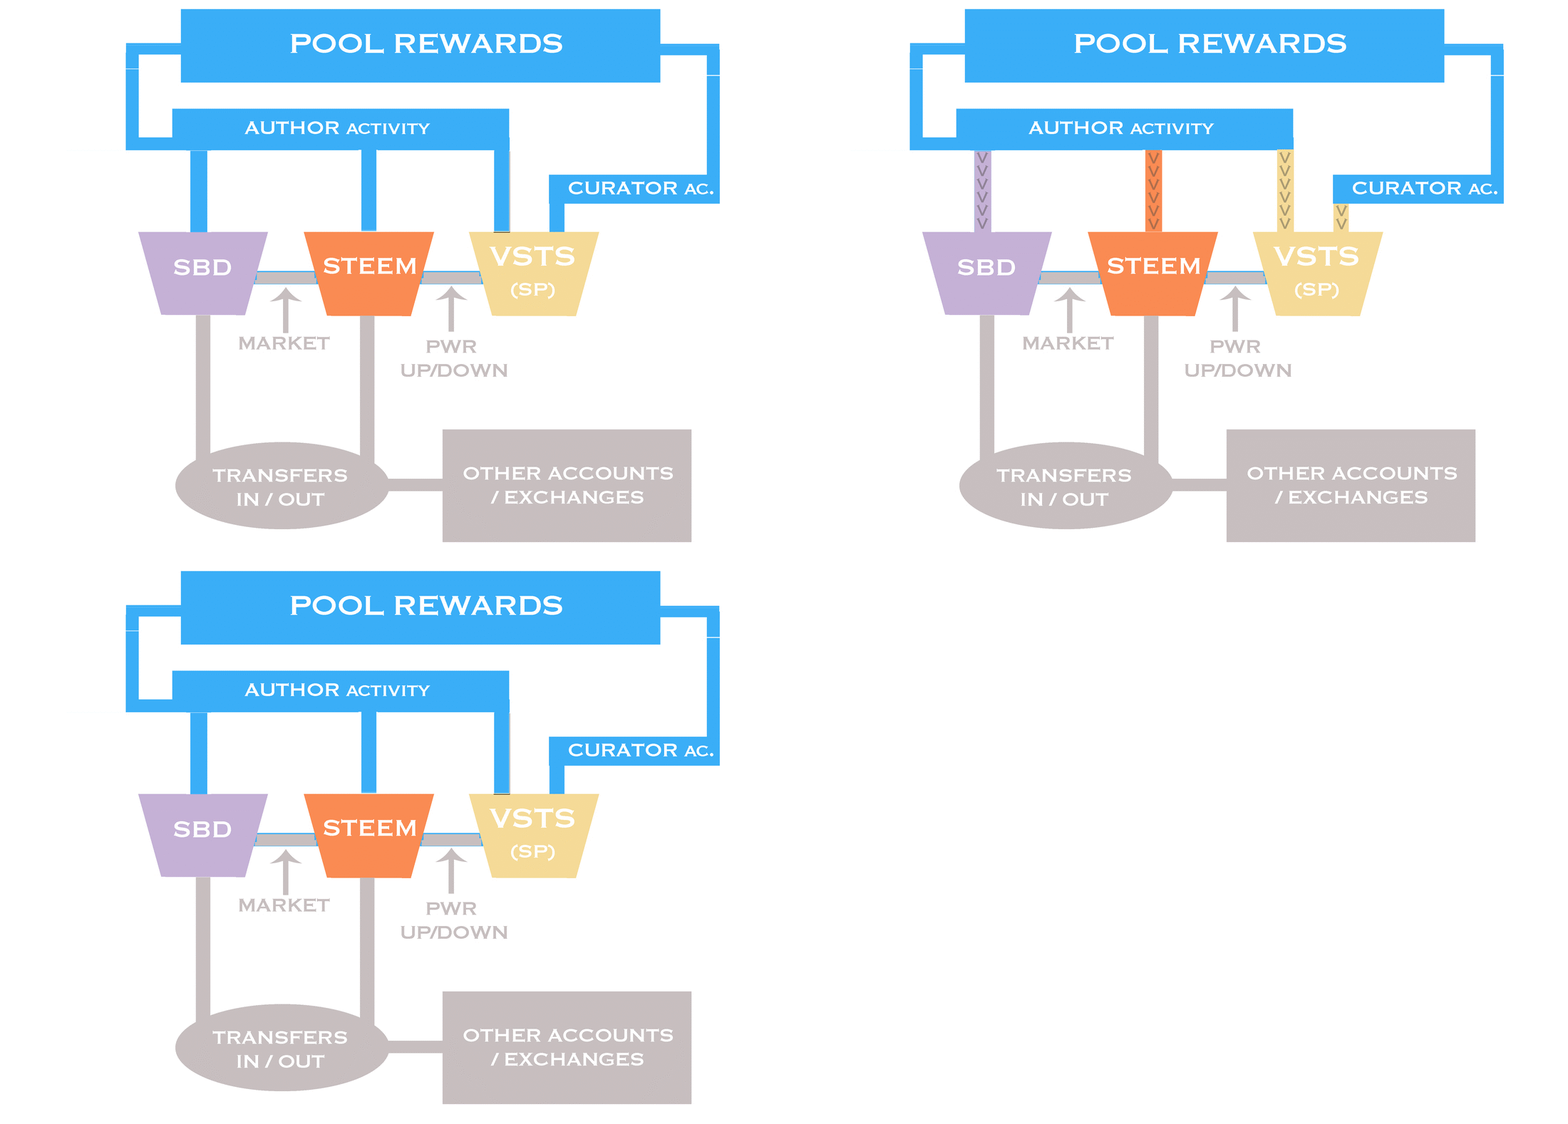
NOTE: Technically the flows of the MARKET and POWER UP/DOWN "pipes" involve transfers between different accounts, but I describe it in this way to simplify the exposure.
A reward can be composed of different tokens
- STEEM,
- SBD and
- VESTS (which we usually call STEEM POWER (SP) when it is valued in STEEM))
STEEM: Steem token is the cryptocurrency of Steem blockchain. On Steemit, it can be powered up into Steem Power, traded for Steem Dollars, and transferred to other accounts. On exchanges It can be traded just like any other coin.
VESTS (SP): It is STEEM that is vested into the platform and does not remain liquid (immediately trade-able) once vested. It is the standard measurement of how much influence a user has in the Steem network.
STEEM DOLLAR (SBD): Steem Dollars is abbreviated SBD (Steem Blockchain Dollar). It isl liquid, stable-value currency tokens designed to be pegged to $1 USD. Steem Dollars can be traded with STEEM, and transferred to other accounts for commerce or exchange.
The proportions received in each type of token depend on
The choice in the configuration of the rewards preferences
[50% SBD + 50% VESTS(SP)] or [100% VESTS(SP)]
The type of activity related to the reward:
AUTHOR activity: Rewards in SBD and/or STEEM and/or VESTS (sp)
CURATOR activity: Rewards in VESTS(SP)
2. ANALYSIS
Using the query
SELECT
VOAuthorRewards.timestamp,
VOAuthorRewards.sbd_payout,
VOAuthorRewards.steem_payout,
VOAuthorRewards.vesting_payout
FROM VOAuthorRewards
WHERE VOAuthorRewards.timestamp < '2018-6-01 00:00:00'
and grouping the cumulative amounts of the number of tokens per months we can obtain the sum of all the tokens (by token type and its total sum) throughout the total period [July 2016 to May 2018],
Note 1: Although the different tokens can have different values when used as currency, for example when converting them to USD, here I manage them as simple amounts or numbers of tokens which allows me to add certain amounts of SBD, STEEM and VESTS( SP) together
Note 2: In this case only author rewards are included. Later, those corresponding to the curation activity are also included)
Evolution of the total SUM of rewarded tokens per months
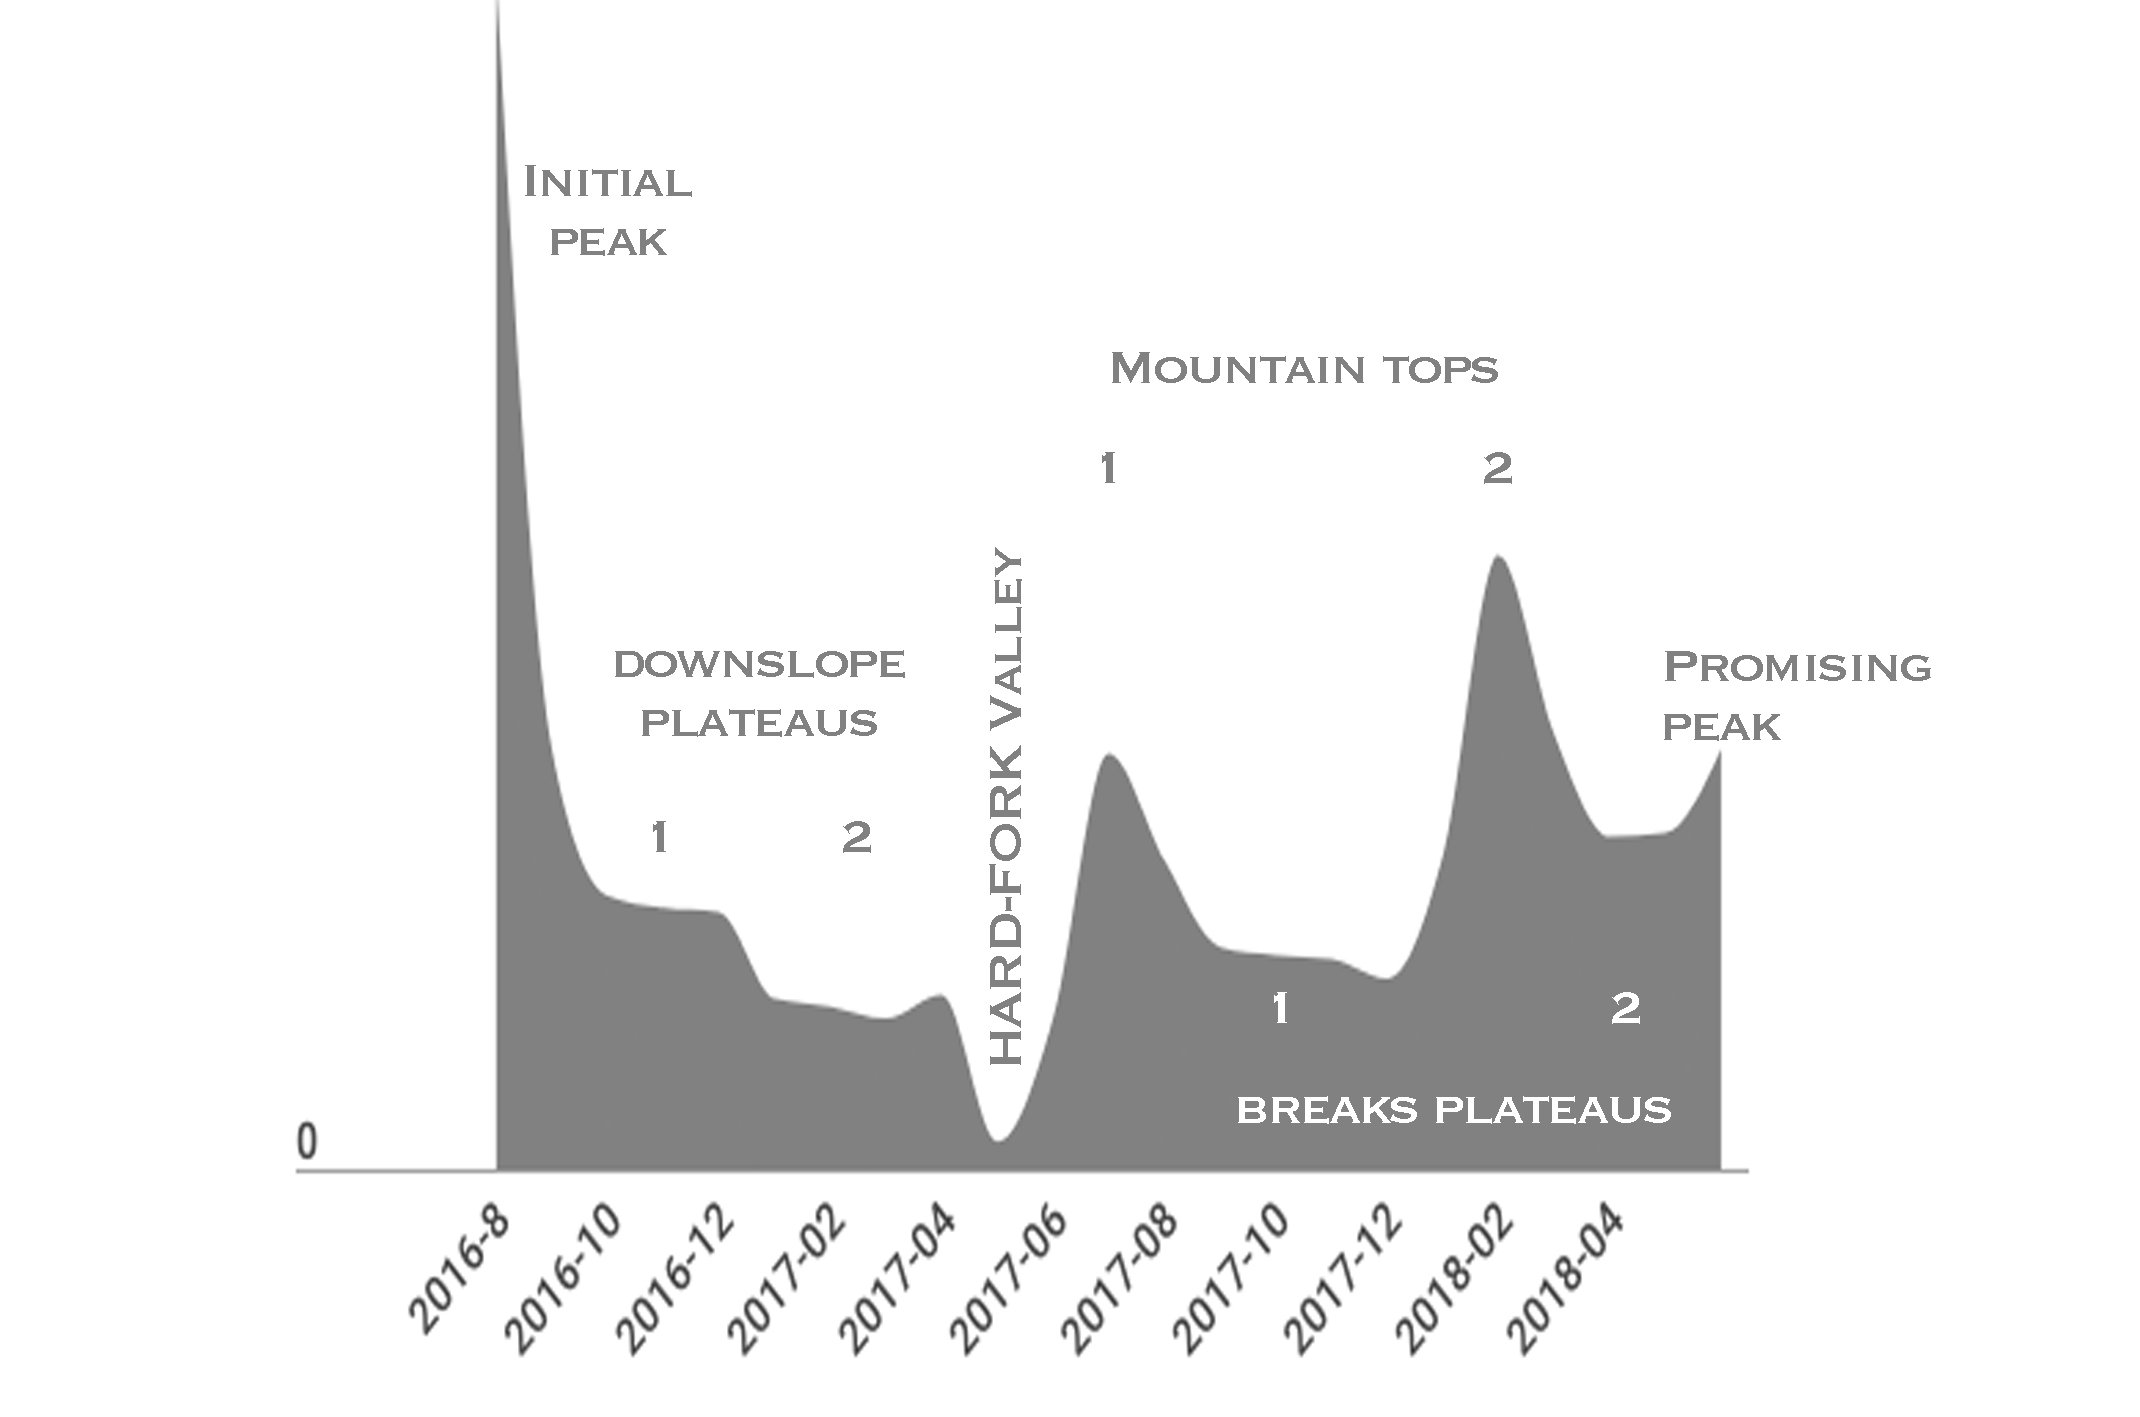
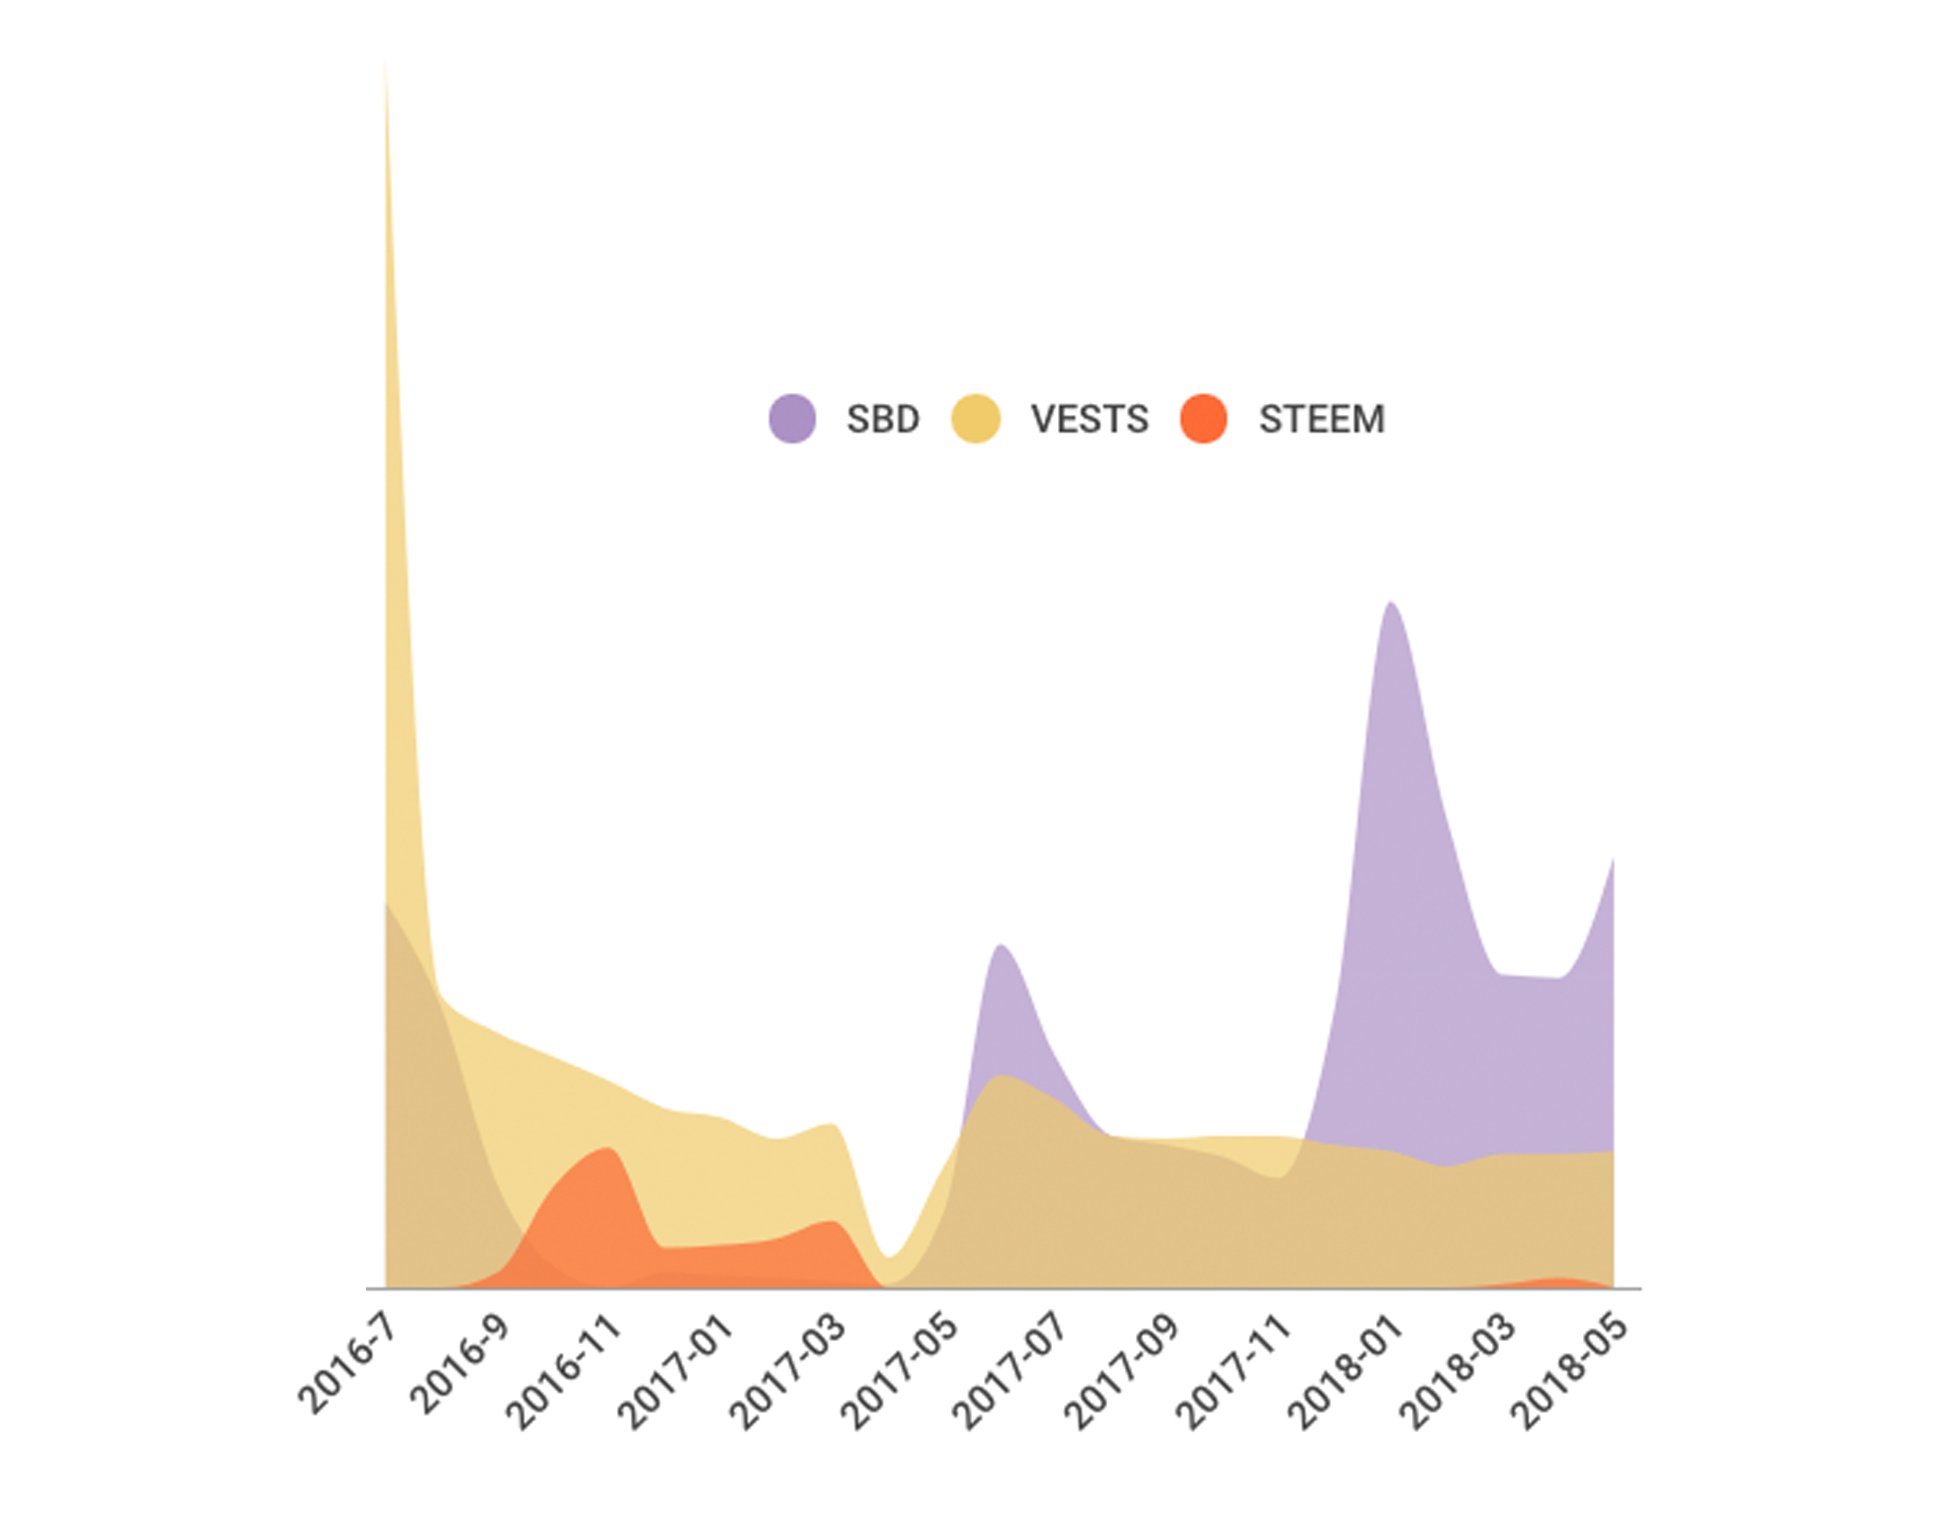
The resemblance of the resulting graph with a mountain chain serves as an excuse to describe its shape that represents the evolution of total rewards.
First peak or initialization peak: Although the activity started in March 2016, the payments of the first rewards were postponed to coincide on July 4, 2016, which may explain the great height of this first peak.
Downslope Plateus (1) and (2): A large drop in the number of rewarded tokens tends to stabilize at times but aims to fall dangerously to its lowest level in the next stage. Surely the pioneers of Steem / Steemit had to agree to make some important decisions in this period of uncertainty.
Hard-Fork Valley, (or Death Valley or Resurrection Valley;)):
I am not an expert in hard-forks and I do not know the details of the ones in Steem / Steemit but here it seems that there was one. It may be that the decrease in the number of rewards was the cause for making changes or perhaps it was the proximity of the hard-fork that caused the fall of the rewards due to the paralysis in the activities in the blockchain.Stages of tops mountains and breaks plateus: Two very steep increases in the number of rewarded tokens that coincide with two waves of growth in the number of accounts and activity in Steem/Steemit followed by breaks plateaus at somewhat lower altitudes.
Promising peak: Finally there is a promising increase in the number of rewards in the month of May 2018 that we still do not know if it will become another top mountain or take a plateau shape.
Let's differentiate the rewards
according to the type of token (STEEM, SBD and VESTS)
REWARDS EVOLUTION IN VESTS (SP)
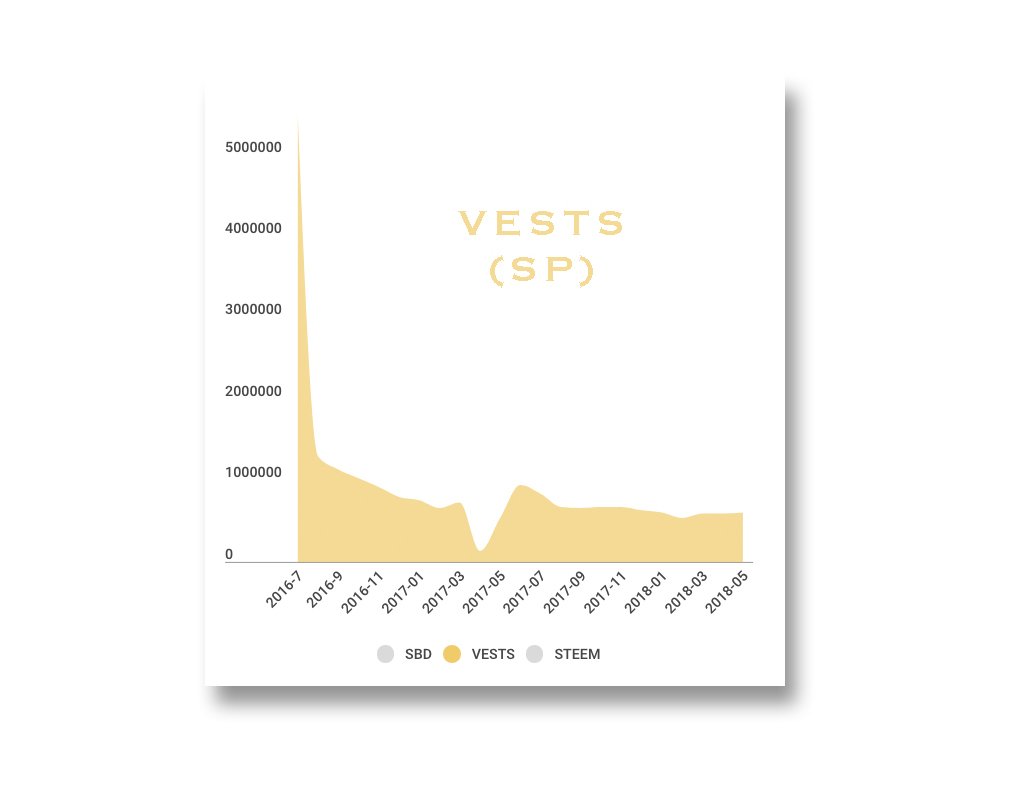
Except for the Initial peak and the Hard-fork valley, the rewards delivered in VESTS tend to STABILITY around 600k (SP) per month.
REWARDS EVOLUTION IN SBD
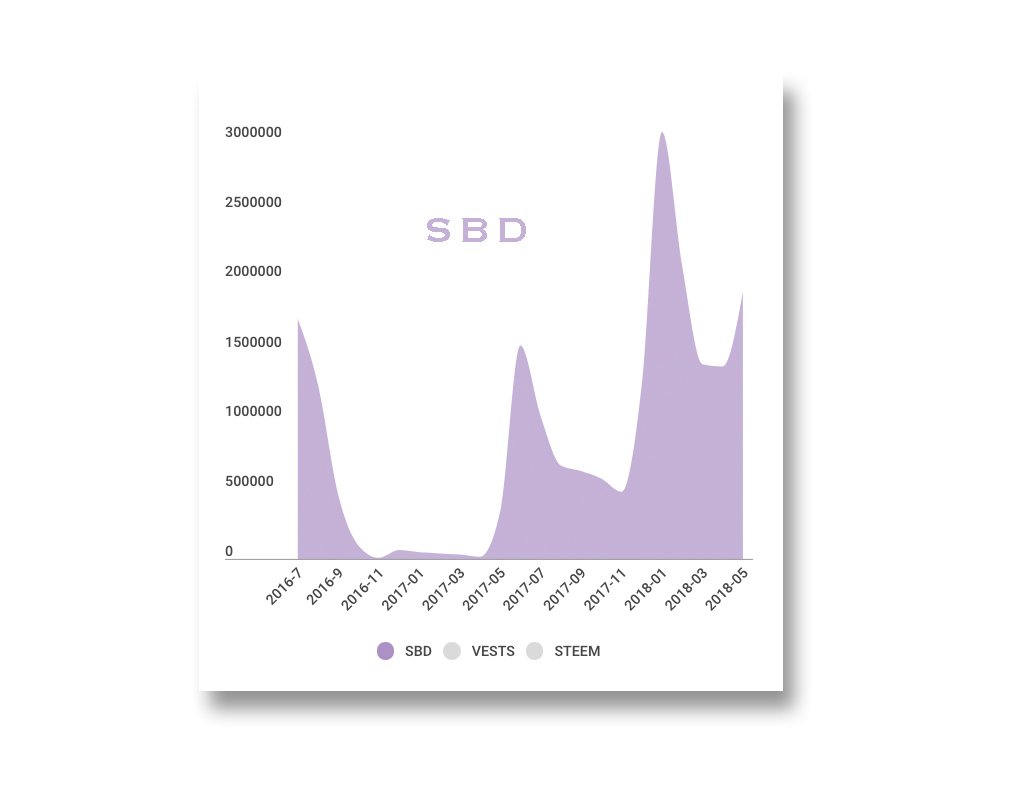
The rewards paid in SBD show a great variability with clear stages of great impulse and later falls and some moments of rest or perhaps they can be seen as recharging moments for the next impulse.
As these peaks coincide with the waves of new accounts, it seems that this is the reflection of moments of great euphoria in the activity of an approximate duration of two months.
REWARDS EVOLUTION IN STEEM
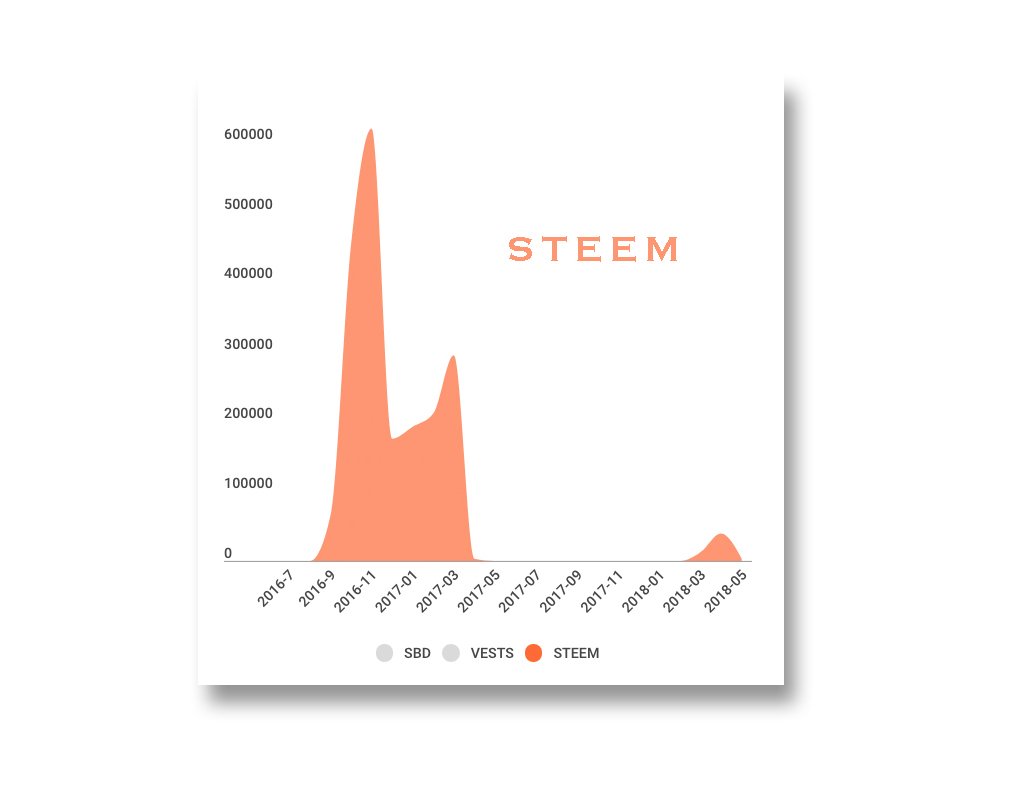
Before starting this analysis I thought that the rewards were only paid in SBD and VESTS(SP). In fact, it has been like this for a period of time [2017-05 to 2018-02] but until 2016-04, just before the Hard-Fork Valley, author rewards were also paid in STEEM and reactivated again from 2018-03 (although by an order of magnitude much smaller in proportion to the rewards in SBD and VESTS.)
I do not know the reasons for this behavior of the payments of the rewards directly in STEEM.
More detailed analysis for the period April 2017 - May 2018
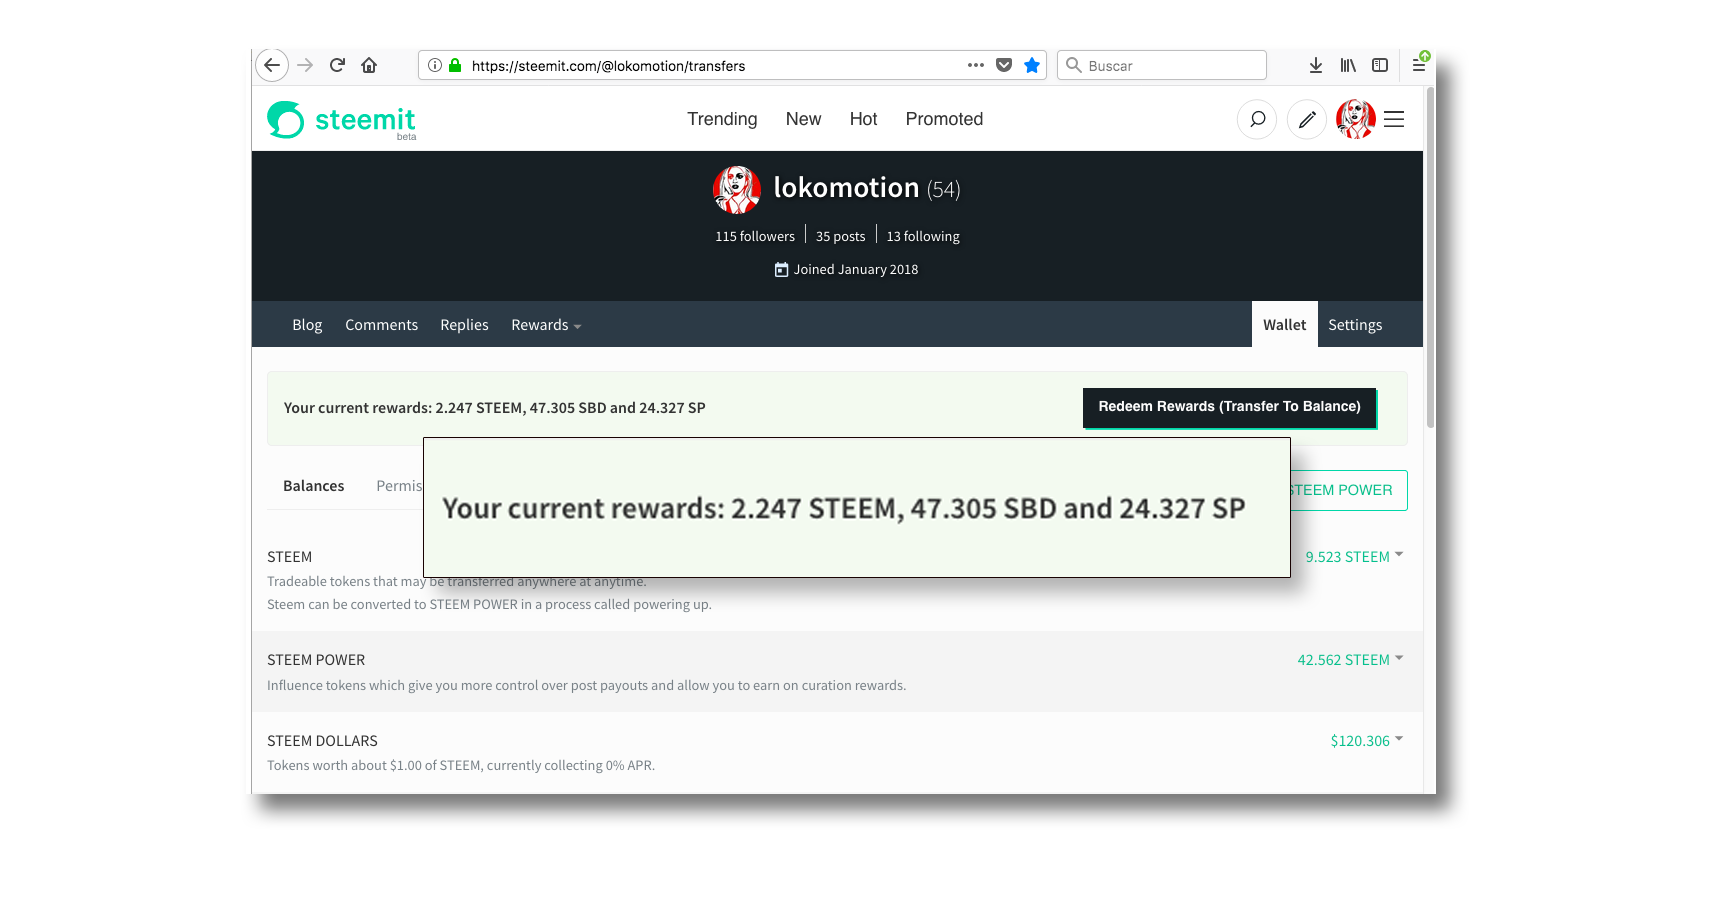
For this I will use the data contained in the table TxClaimRewardBalances which was just initialized on March 30, 2017 and is related to the *Redeem Rewards" (Transfer to Balance) Button.
This table contains all the rewards (author + curator) in the three types of tokens.
Query:
SELECT
TxClaimRewardBalances.timestamp,
TxClaimRewardBalances.account,
TxClaimRewardBalances.reward_steem,
TxClaimRewardBalances.reward_sbd,
TxClaimRewardBalances.reward_vests
FROM TxClaimRewardBalances
WHERE TxClaimRewardBalances.timestamp < '2018-6-01 00:00:00'
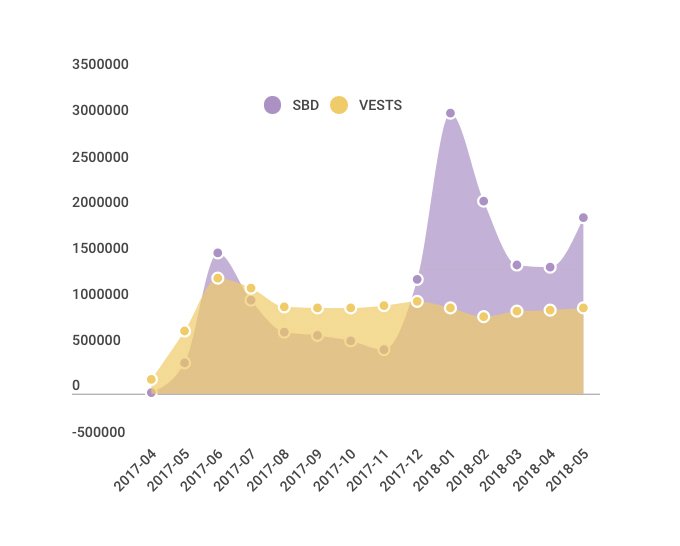
Note: I will focus only on the rewards in SBD and VESTS since the rewards in STEEM in this period are zero or very small.
Continuing with metaphorical descriptions to characterize the evolution of the behavior of the rewards observing this graph I see
"A calm sea of constant level of VESTS" on which some "unstable tsunami of SBD are generated".
The "VESTS-stability" represents "the confidence in future growth" and SBD-impulsivity "the desire for short-term gain and/or protection against the risk of the uncertain future".
"it's like a dynamic balance and coexistence between VESTS-stability and SBD-impulsivity in which at times one predominates over the other.
Therefore, we are now surfing on the remains of the January 2018 tsunami that seems to have a replica that moves through a level of stability that seems certain at least for the next months.
Number of unique rewarded accounts by token
Let's see the number of unique accounts involved in the monthly rewards throughout the last year differentiating by token type.
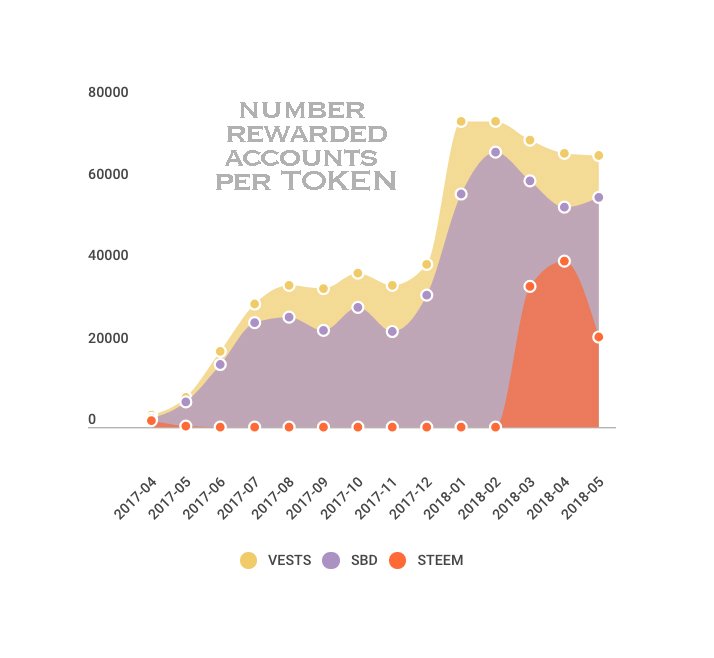
Between July and December 2017 the number of accounts rewarded in SBD and VESTS was fluctuating in values between 25k and 30k accounts, the amount in VESTS being higher because it includes at least 50% of the authors' rewards plus the rewards of the curators.
Since January 2018, when the number of accounts involved in the rewards multiplied by almost a factor of two, and up to the present, it seems that another stationary wave has been established that fluctuates around 60k accounts. In May 2018 there were 56,309 single accounts rewarded in SBD and 66,417 single accounts rewarded in VESTS.
The growth of the number of accounts rewarded in STEEM has grown since March 2018, although, as indicated above, the amounts rewarded in this token are (at the moment) very small in comparison
Evolution of average reward per account
The following graphs shows the average reward per account in each token SBD and VESTS (SP).
Average Rewards in VESTS (SP)
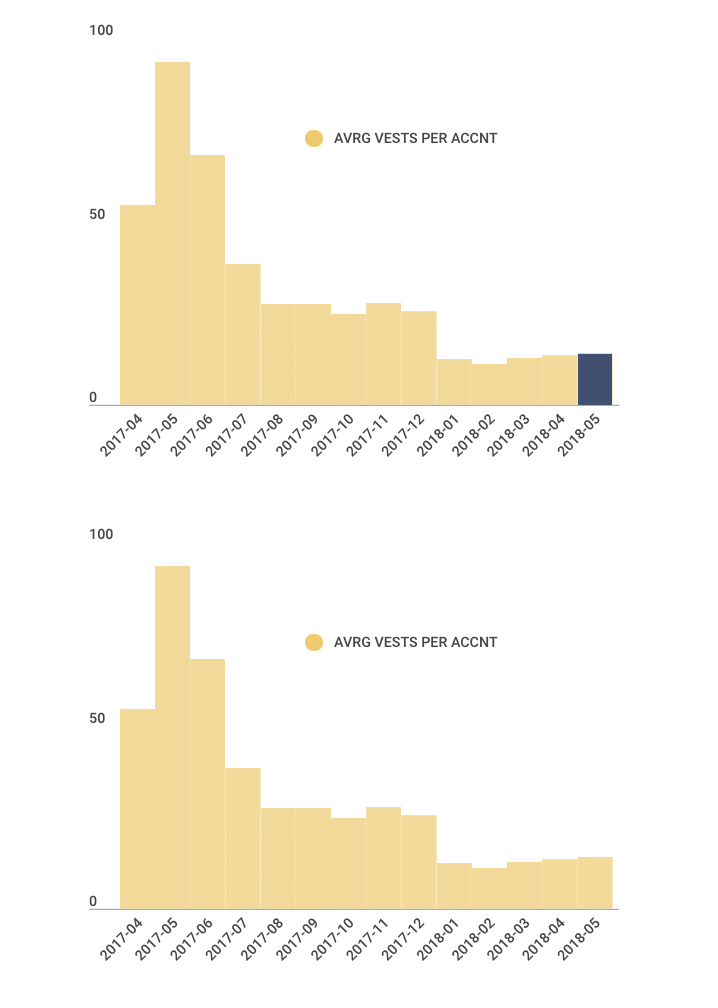
*Average for May 2018: = 14.09 SP
The average reward in VESTS (SP) has been decreasing coinciding with the sudden increase of new accounts that get rewards. There is a slight increase in the last three months as the number of rewarded accounts decreases.
It's as if the rewards for stability are a limited resource that are shared by all the participants.
Average Rewards in SBD
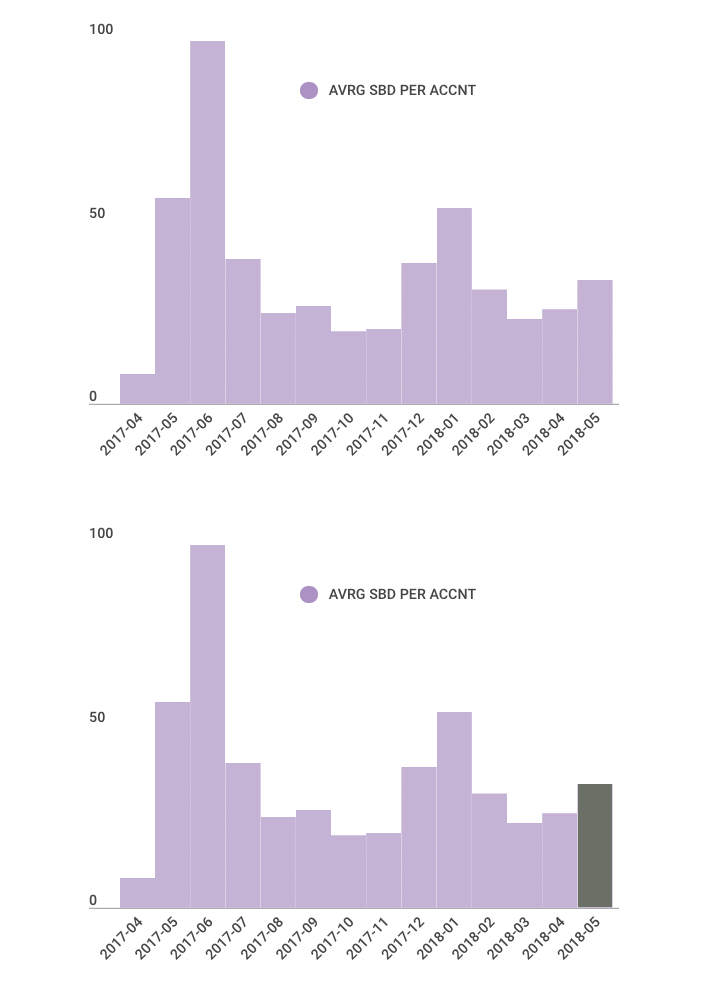
Average for May 2018: = 33.99 SBD
The average reward in SBD presents two very different and opposite types of behavior:
Until November 2017 follows a pattern similar to the case of VESTS, (the average decreases when the number of accounts increases)
On the other hand, since December 2017, it evolves in the opposite way since the average increases when the number of rewarded accounts increases.
*It's as if the rewards for impulsivity were not shared. I think this reflects the fact that the new accounts are very active, that is, their first months of activity are very "euphoric" which raises the average of the rewards.
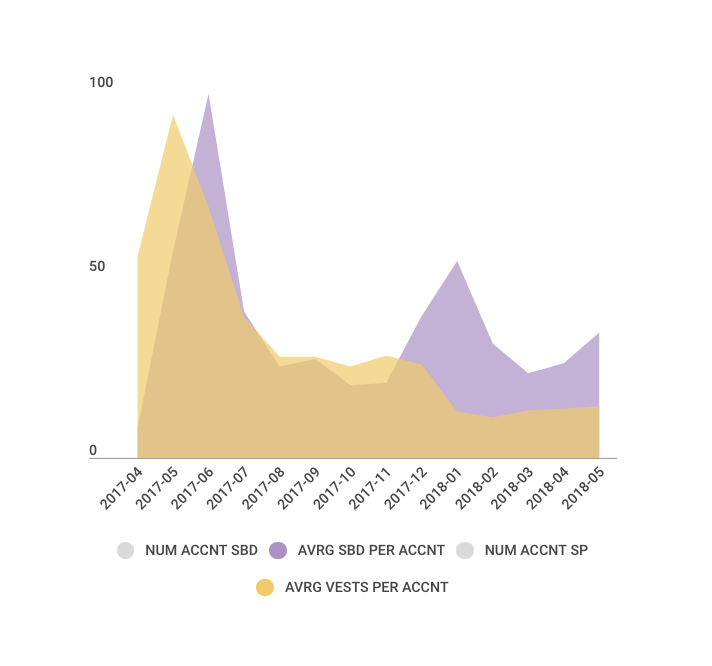
Analyzed together we can distinguish three situations or ages:
- When Num. VESTS are greater than Num.SBD
- When Num. VESTS are similar Num. SBD
- When Num VESTS are smaller than Num. SBD
I will use this classification of different states or ages in the following section that analyzes the most active accounts responsible for this behavior.
Characterization of accounts
by strategy of obtaining the rewards in a given token
Most rewarded accounts by token
Num. VESTS + Num. SBD = TOTAL
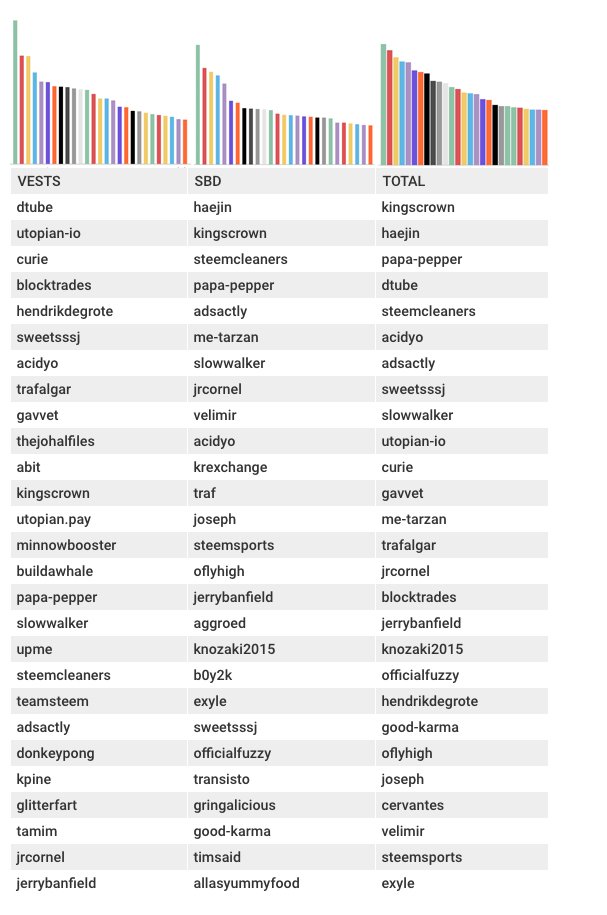
Due to the distinct nature of the tokens we can use it to characterize the accounts based on their activity in obtaining rewards based on the amount and proportion of tokens obtained.
It could be hypothesized three different main strategies carried out by different account groups. Using the previous accounts that have obtained more rewards (in total and in the different tokens) I have classified them in three sets with similar activity in what refers to the obtaining of rewards.
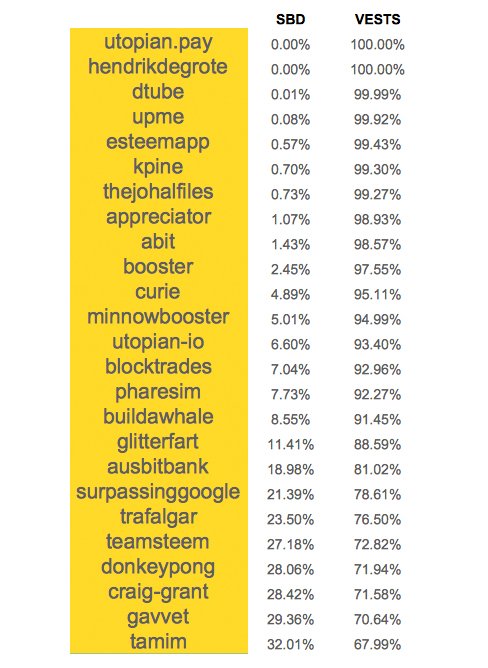
Set of Yellow accounts :
VESTS (avrg: 89%) >> SBD (avrg: 11%)
The proportion of tokens in VESTS are greater than in SBD. It could be said that this strategy is focused on obtaining more power of decision. Following this strategy implies more commitment and long-term vision with the ecosystem, which may lead to more benefits in the future but also more risk. Although they may have activity as authors, the curative activity is more relevant.
- It is the second most numerous group and gets 35.24% of the rewards with an average of 56k tokens per account.
Set of Purple accounts :
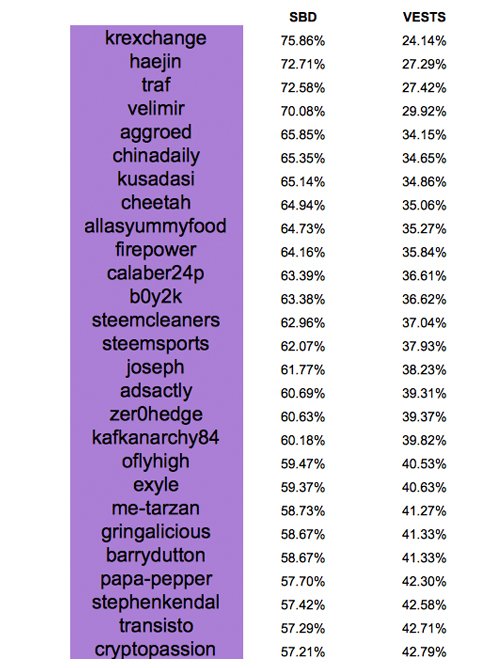
SBD (avrg: 63%) >> VESTS (avrg:37%)
The proportion of tokens in SBD are greater than in VESTS. These accounts are more focused on liquidity in the short term and controlled risk (due to the minimum parity with the USD) and not so much in the accumulation of power to obtain future benefits, therefore the commitment to the ecosystem is lower. The activity is more oriented to the creation of posts to be rewarded by them.
- It is the most numerous group and the one that together obtains the highest rewards, 40.19% of the total with an average of 58k tokens per account.
Set of Green accounts :
SBD (avrg: 49%) == VESTS (avrg: 51%)
The proportion of tokens in SBD and VESTS are similar. This strategy is a mixture of the previous ones, obtaining at the same time accumulation of power of decision and control of the risk.
- It is the least numerous group obtaining altogether 24.56% of the rewards with the highest average of 69k tokens per account.
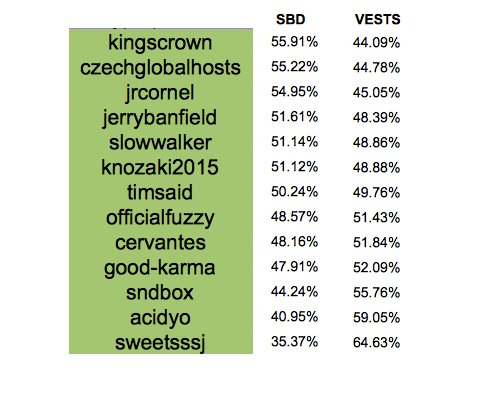
What is the most profitable strategy and how are they combined
I have sorted the most rewarded accounts (by total SUM of tokens) marked by the color of the set in which I have included them. I have distorted some graphics to appreciate the mix of colors and which are the predominant ones in the first positions.
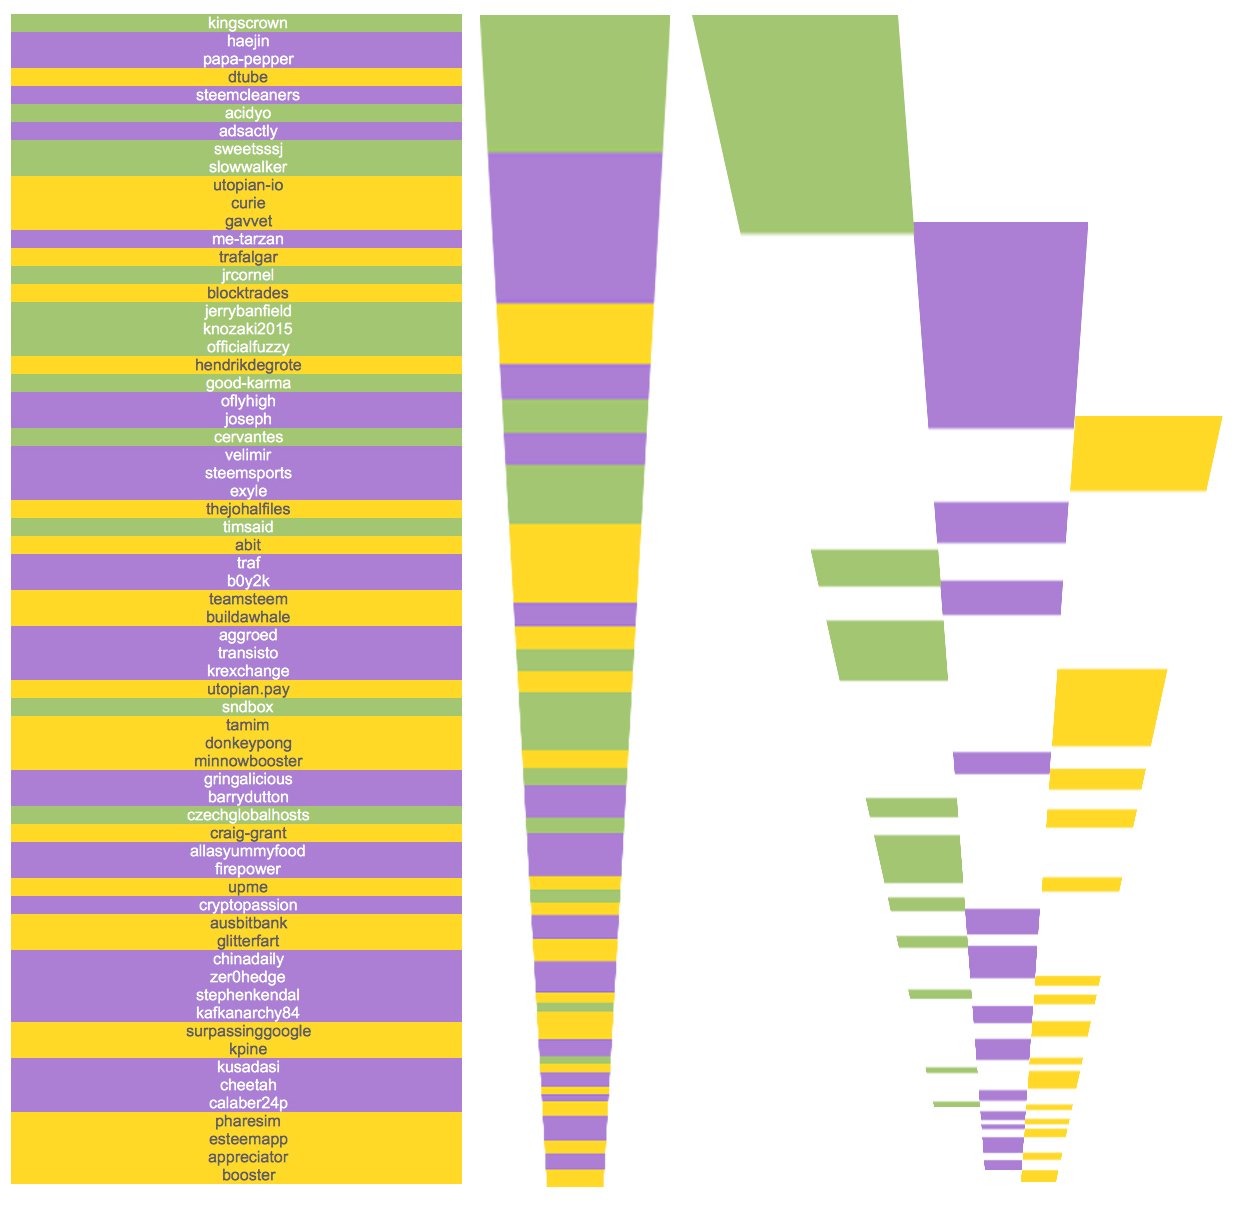
You can see how the green color tends to cluster at the top, which indicates that this is the most profitable strategy (in number of tokens) in the last year, that is, those accounts that present a strategy that combines stability and vision of the future with risk control and liquidation of the obtained rewards.
The purple or impulsive strategy has prominent representatives in the upper part and then distributes more in the middle and lower parts.
The presence of yellow (stable long-term strategy headed by the @dtube and @utopian-io accounts) along the entire color column denotes the strategy that adds stability and long-term commitment to the ecosystem.
In general it could be said that this mixture of the three colors or strategies denote a good structure that mixes strength and flexibility or stability and impulsivity.
4. DATA SOURCE, SCOPE & TOOLS
DATA SOURCE
I have used SteemSQL, a publicly available Microsoft SQL database containing all the Steem blockchain data held and managed by @arcange.
SCOPE
- Raw Data 1 from 2016-3-30 to 2018-5-31
- Raw Data 2 from 2017-4-01 to 2018-5-31
TOOLS
