Last week, I had posted about a new tool to visualize the witness schedule in a live setting. Here are a few updates I made to it since the announcement.
Live Visualization
To see the original post and announcement, go to [New Tool] - Witness Schedule - Live Visualization.
Updates
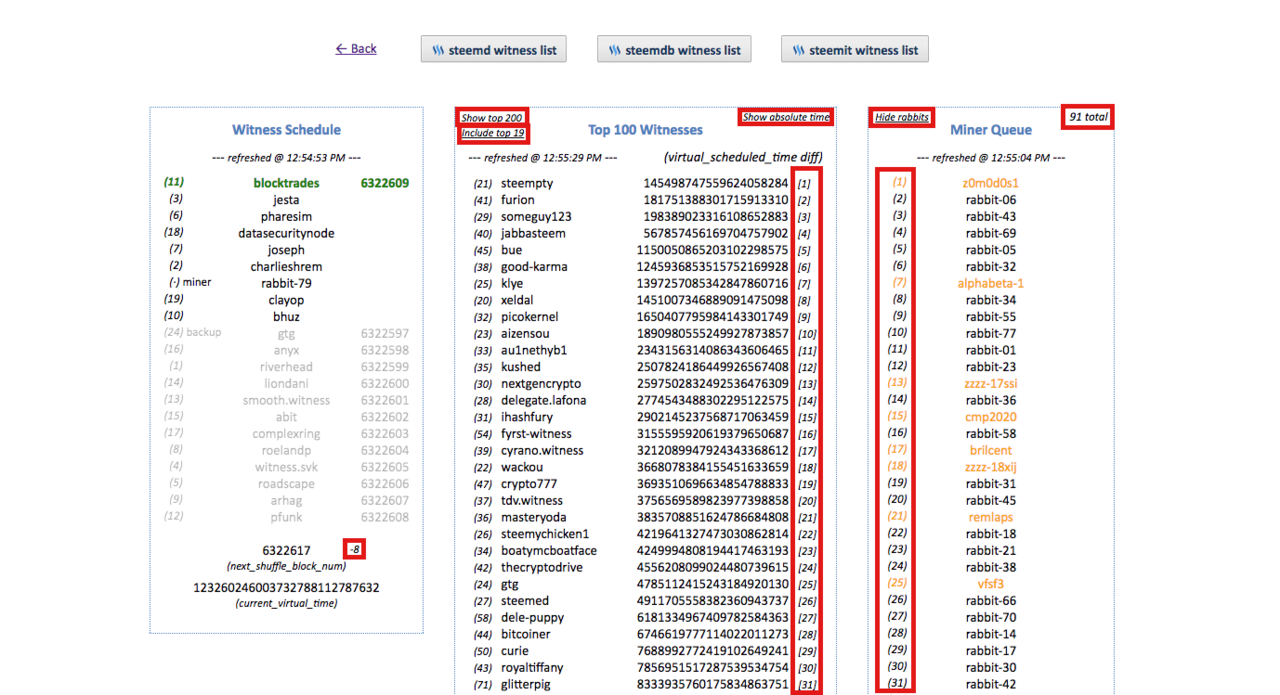
Here is what it looks like currently, with the new elements highlighted in a red box:

Witness Schedule
In this box is a new counter that counts down from the current block to the next_shuffle_block_num.
Top 100 Witnesses
Currently, the top 19 is not included in this list by default. Clicking on the Include top 19 will show them again, in silver, to easily distinguish from the rest.
Also new is by default, the virtual_scheduled_time diff will be shown. This is the difference of the virtual_scheduled_time of a witness from the current_virtual_time. There is the Show absolute time option to show the absolute value if desired.
Next to the virtual_scheduled_time is the ranking of the witness sorted by the least virtual_scheduled_time and when the witness will be scheduled next.
Miner Queue
Next to each miner in the queue is the rank from the top of the queue, when the miner will be scheduled next.
There is now the total number of miners in the queue at the corner of the box.
As there are many rabbit miners, there is now an option to hide them. There used to be supercomputing accounts as well, but they have left for other ventures. The non-rabbit miners will be shown in orange unless the option to hide rabbit miners is used.
Link
Just go to my personal site at bitcoiner.me and click on the button link at the top that says Witness Schedule Live Visualization.
Or you can go directly to bitcoiner.me/schedule.
With this tool, you can now see the blockchain in action and the witnesses at work!
