Regular daily update on BTC ta analysts opinions.

**My summary - short-term sentiment: bearish ** (last: neutral)

- Am early today because I am traveling but we have 3 analysts with updates.
- We are hovering in the 9'200 area. Strong resistance at 9'750. Several analyst expecting another correction before overcoming that one.
- April is used to be a good month for crypto. Lets see how this turns out this time.
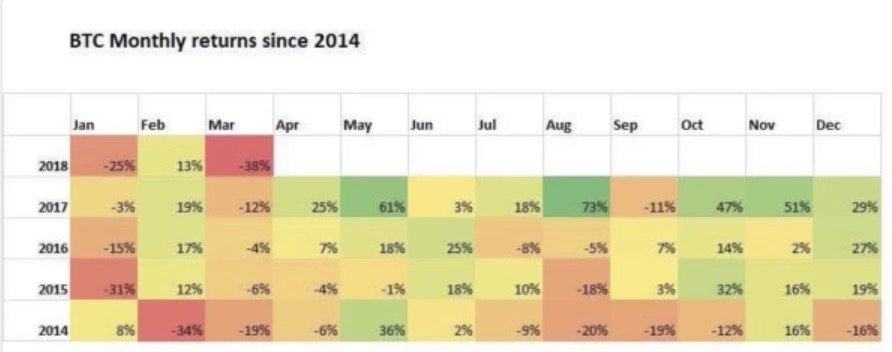
News about the blog
I need to revise my 2018 long term table. I need to add a 2018 and 2019 target an be more precise on the sentiment here. Will do that after I am back in Switzerland.
We lunched the bounty project beta. If you are interested and you like to create a bounty on your own have a look at this post
Analysts key statements:
Tone:
- Weekly: Current weekly candle need to close. It can close at the top of the candle or at the bottom. We are kind of stuck. Still he remains bearish.
- Daily: We had huge bearish engulfing (not good) we traded below that 1 which would bring in a short play with stop loss right above the 50 MA. There he expects also the death cross there.
@haejin:
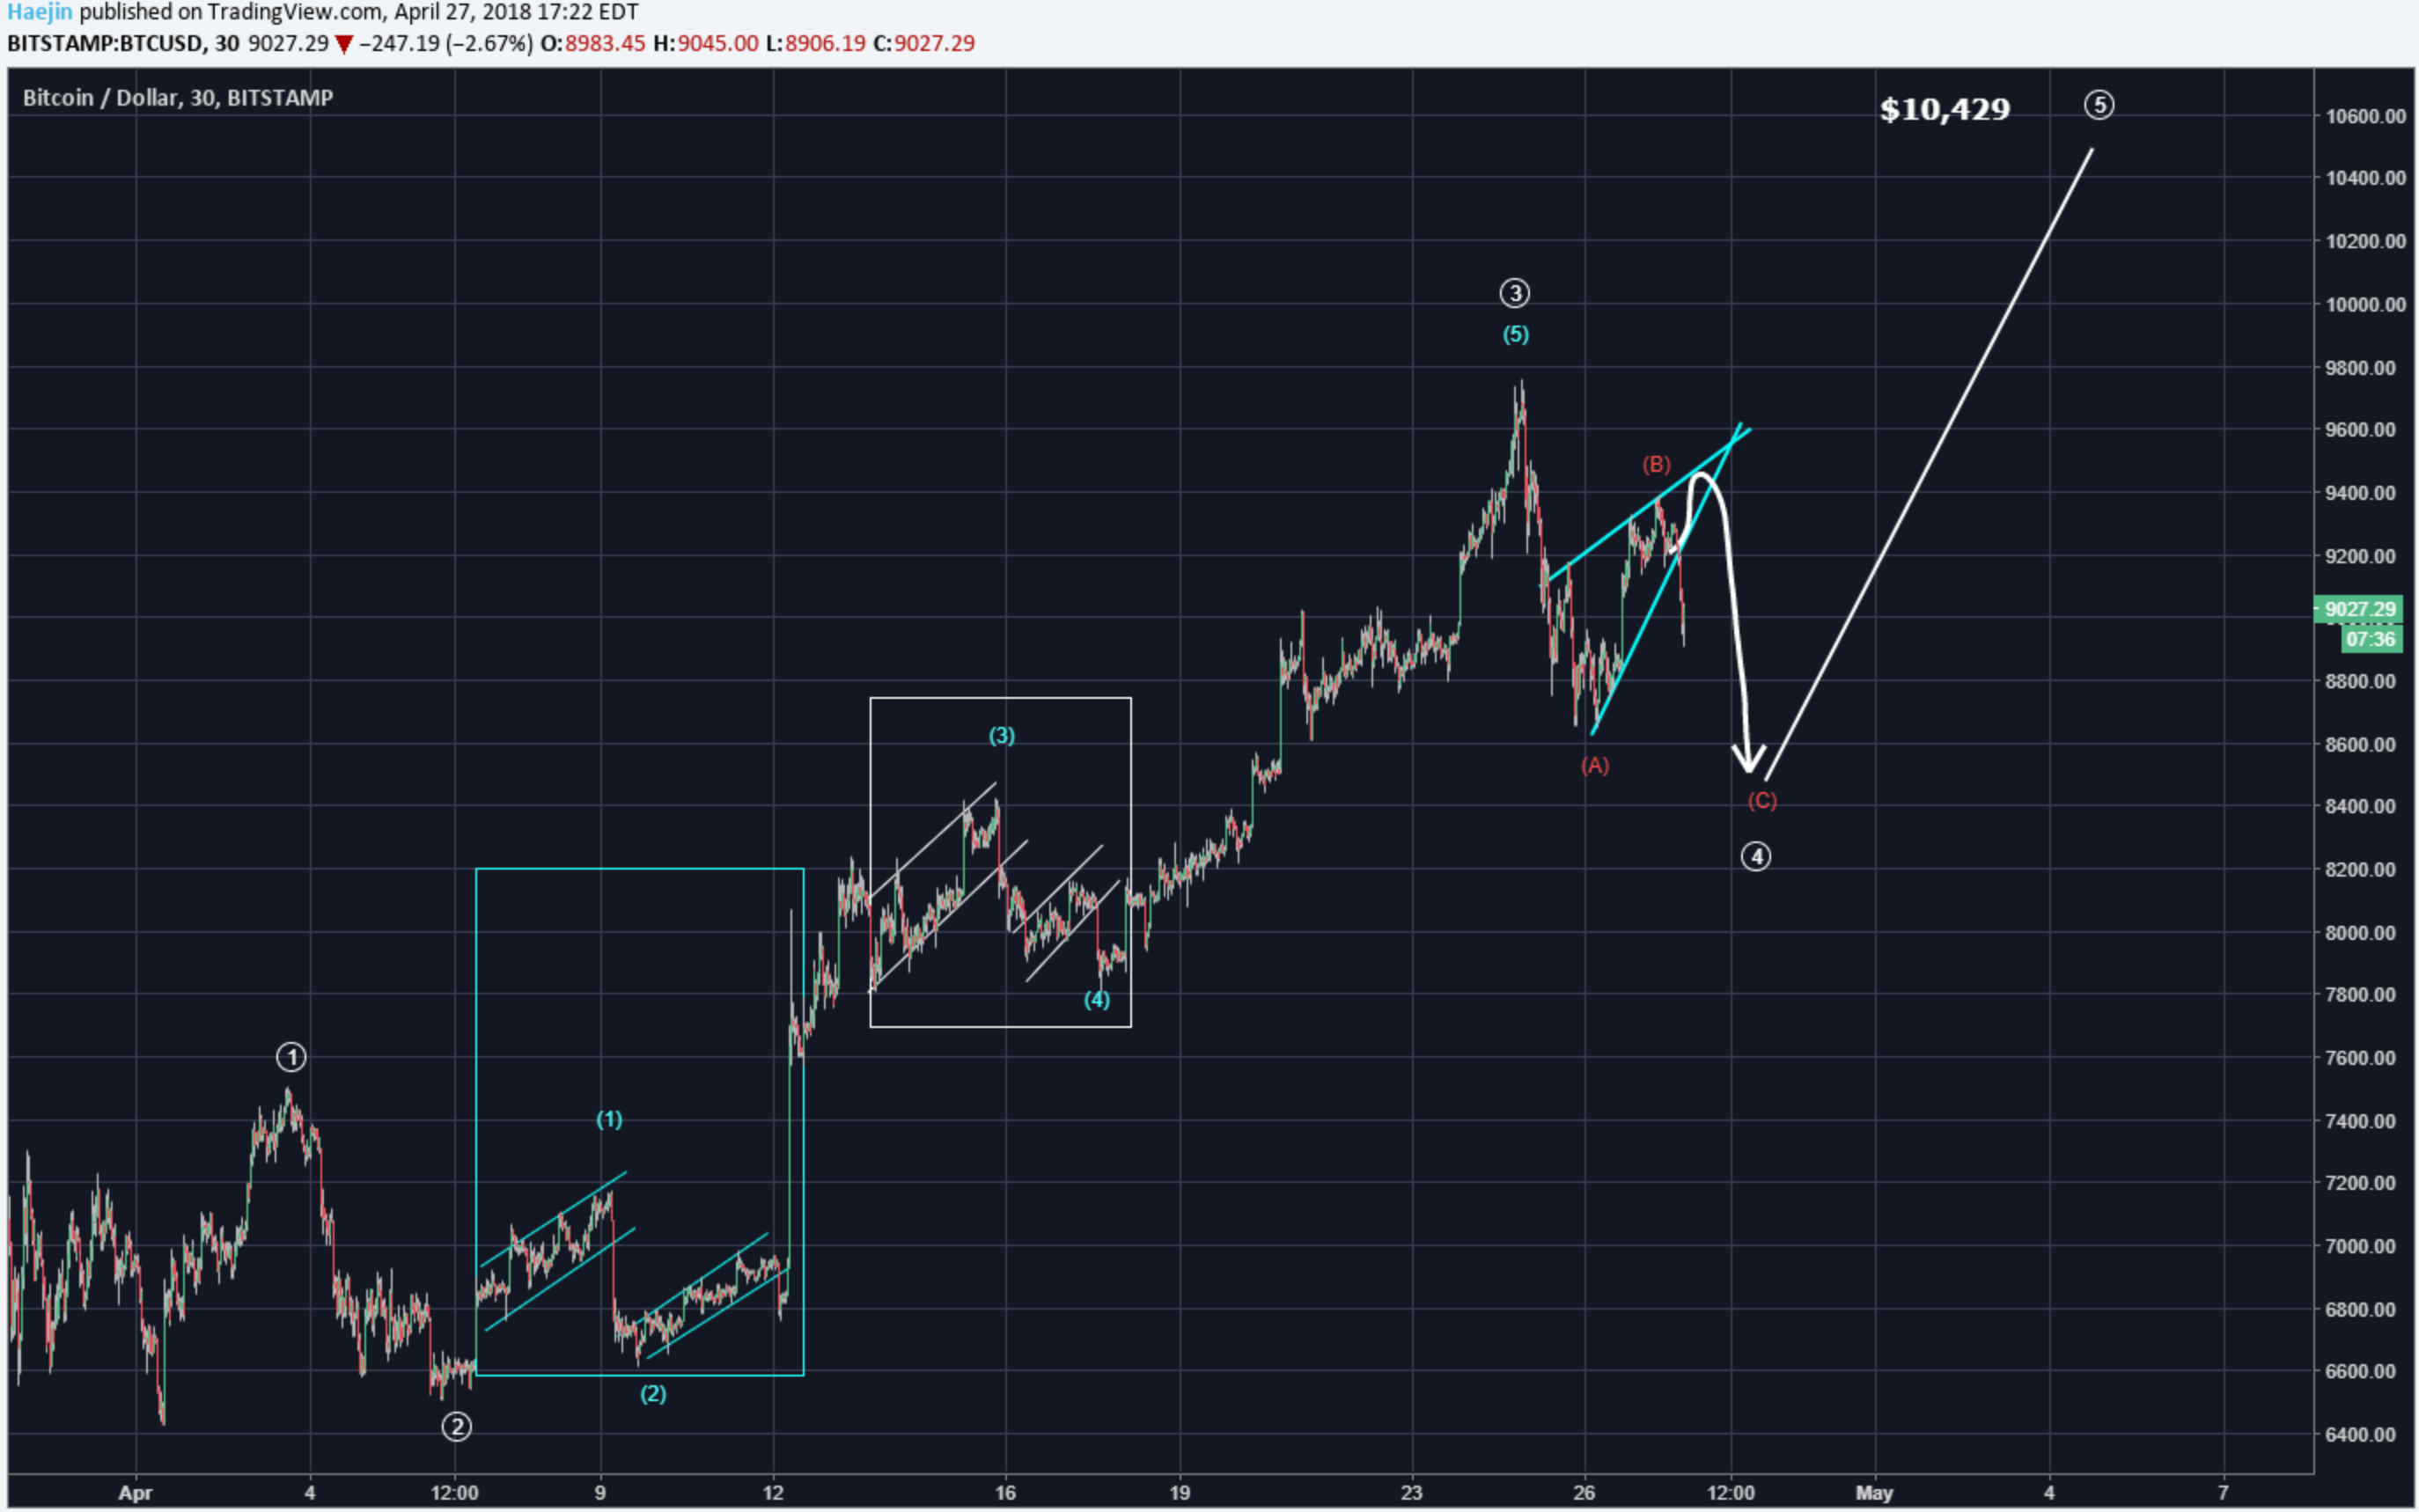
BTC has breached lower blue line of the following scenario.
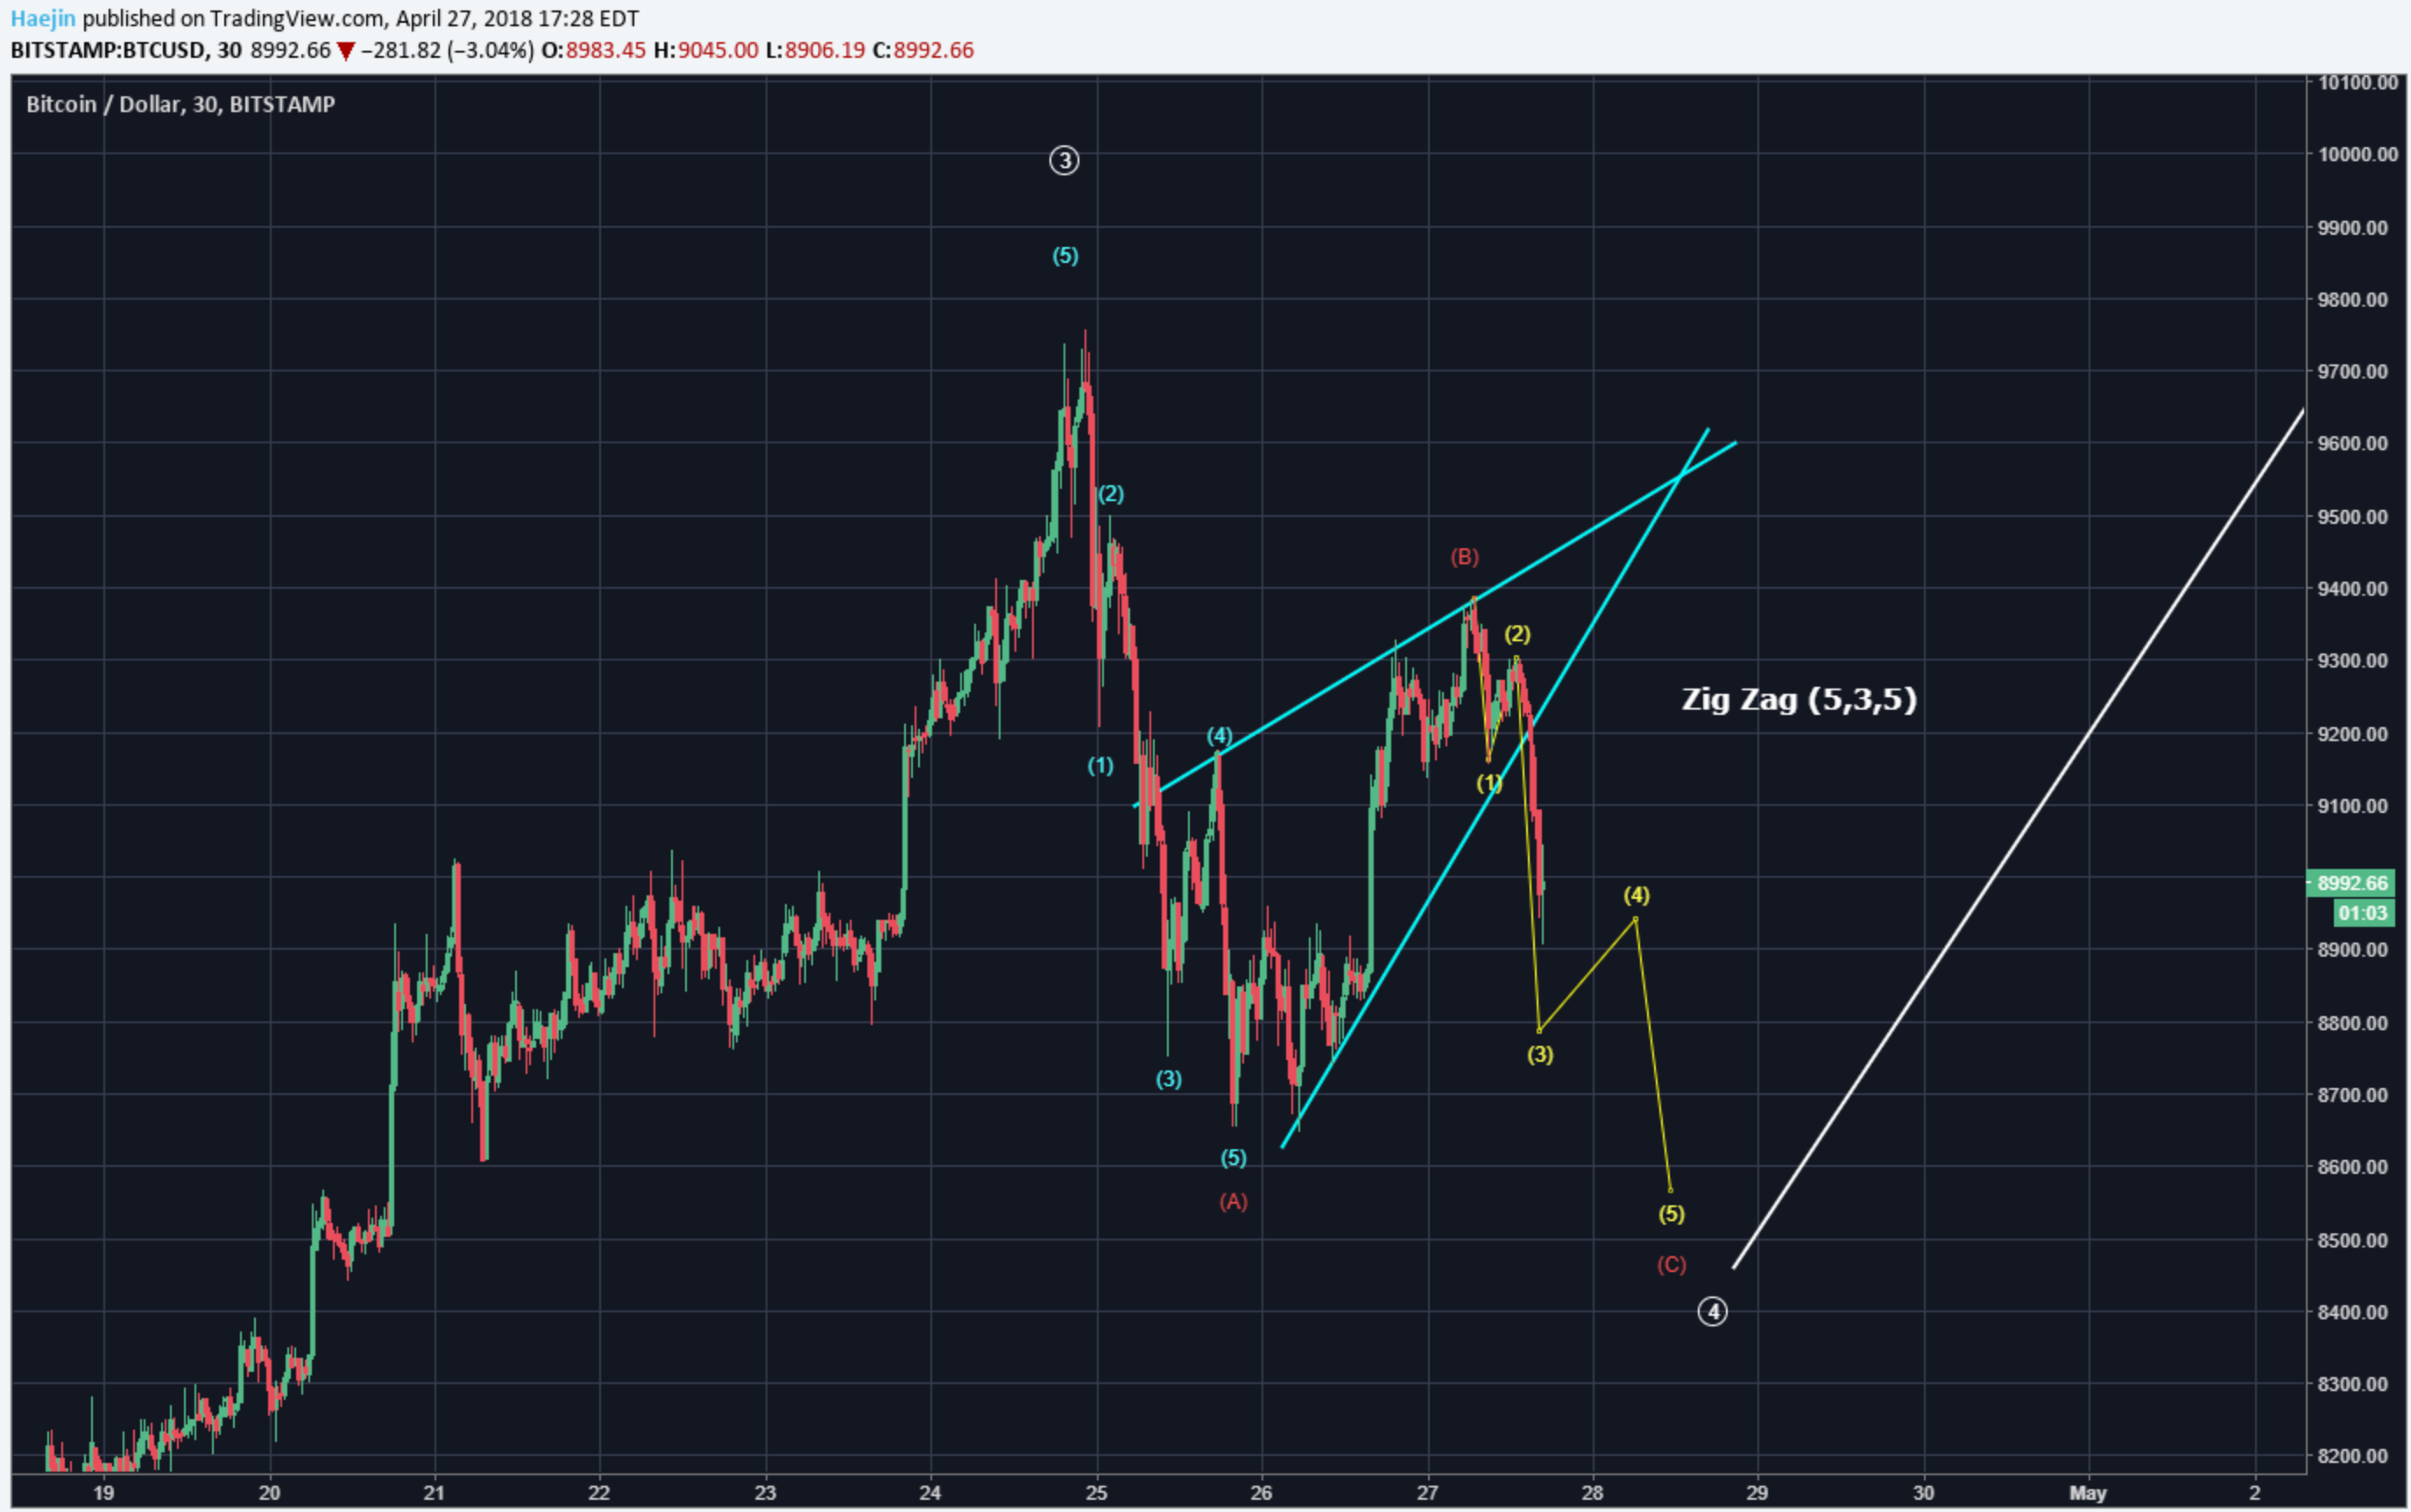
Looking at a close up he see the following waves down with a target of 8'550.
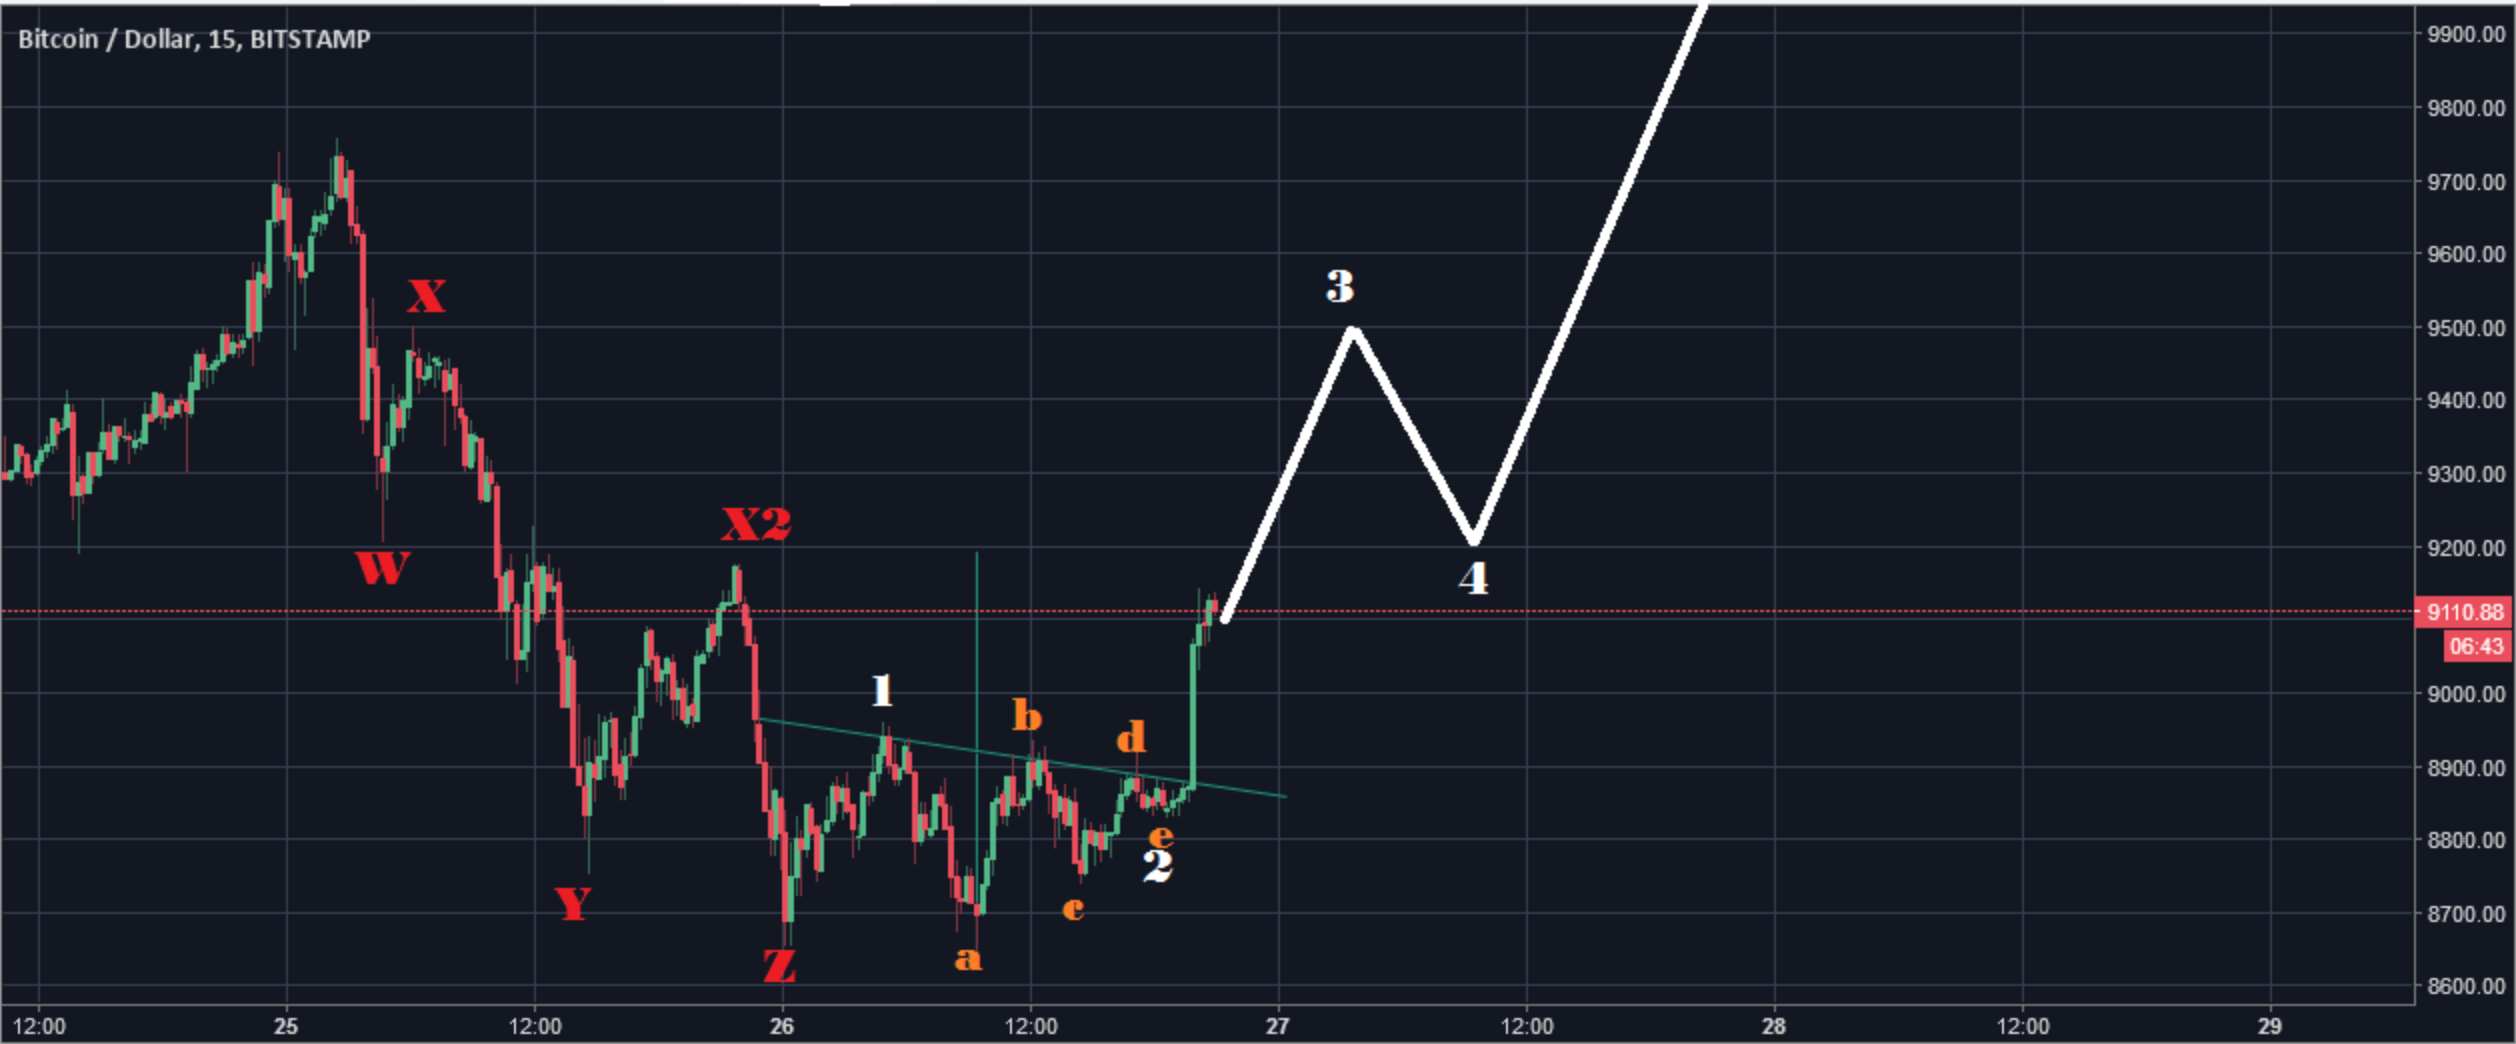
@ew-and-patterns:

Just graphical update - due to lack of his time to comment.
Alternate A (bearish):
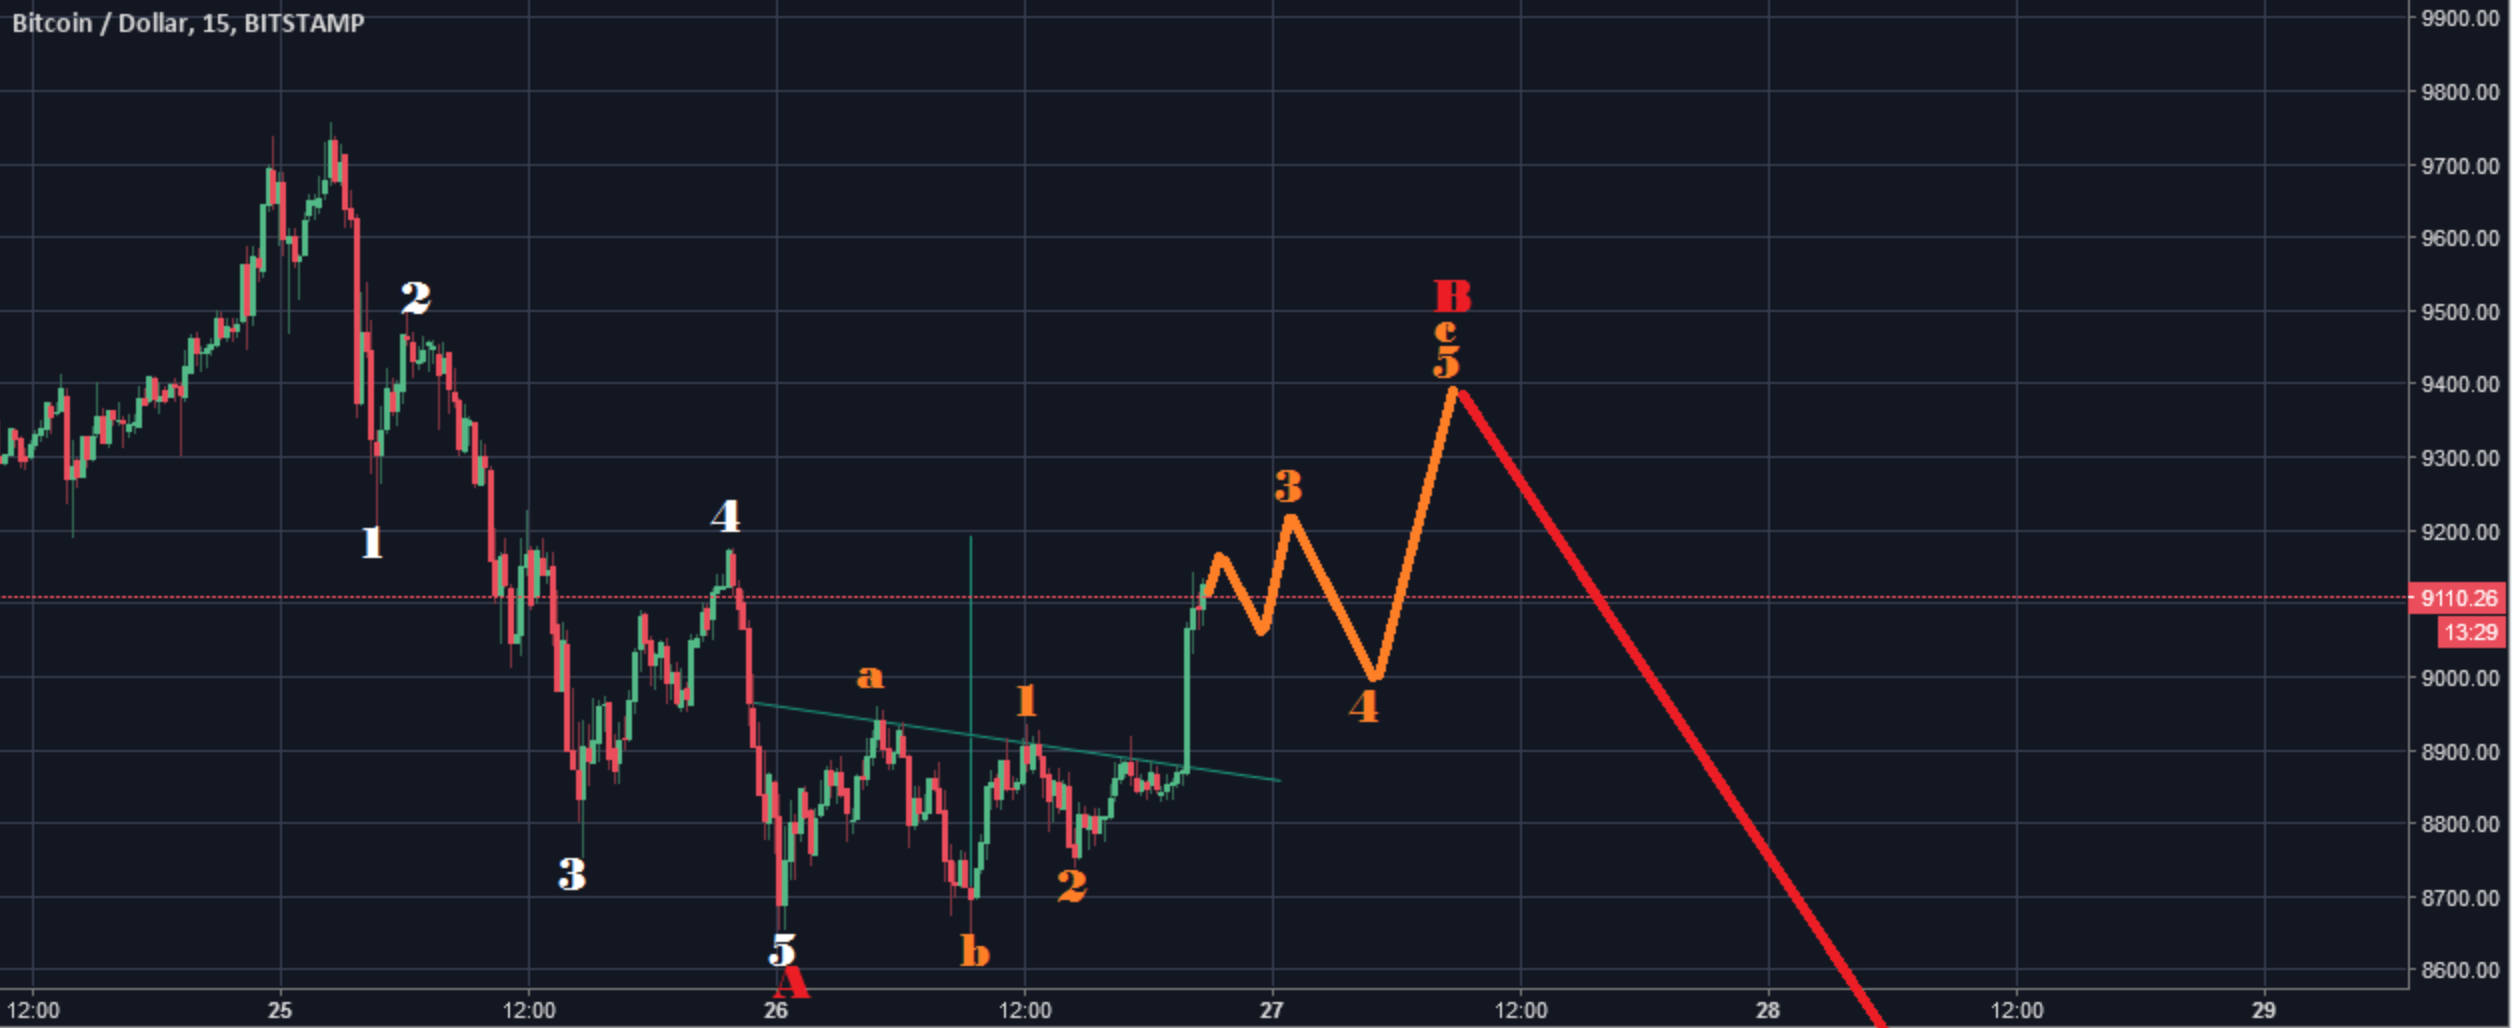
Alternate B (bullish):
@lordoftruth:
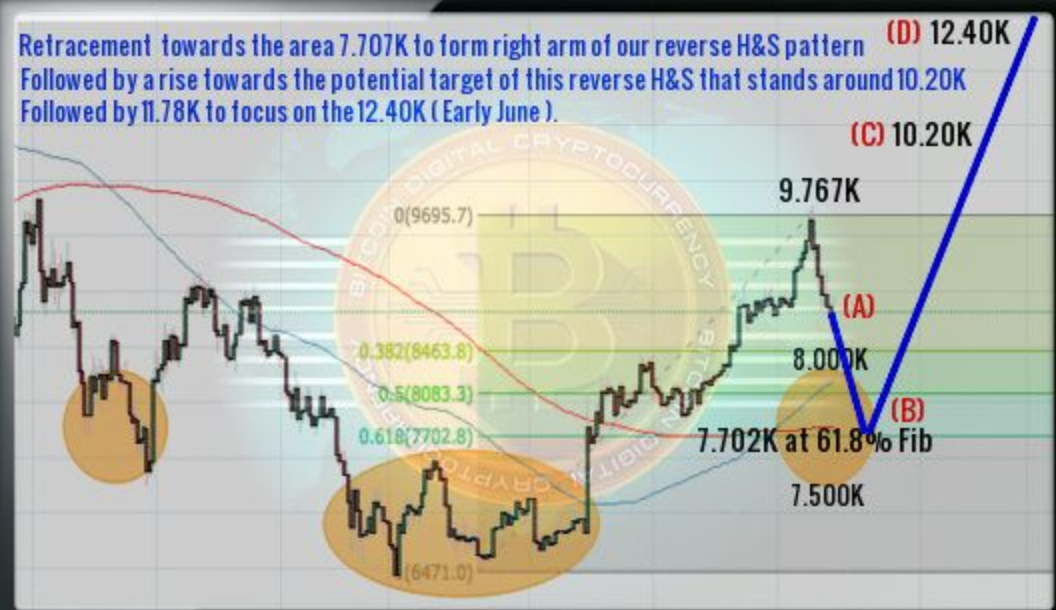
DiNapoli pattern support the target of 12'400 (5/8 reaction form 6'490).
No change in short term forecast. Still expect price to move towards 7'500 - 8'000 (Early May) to build inverted H&S.
Clear breaking of 9'911 will invalid current scenario.
Todays trend is Slightly bullish. Expected trading for today is between 8'643 and 9'400.
@philakonesteemit:

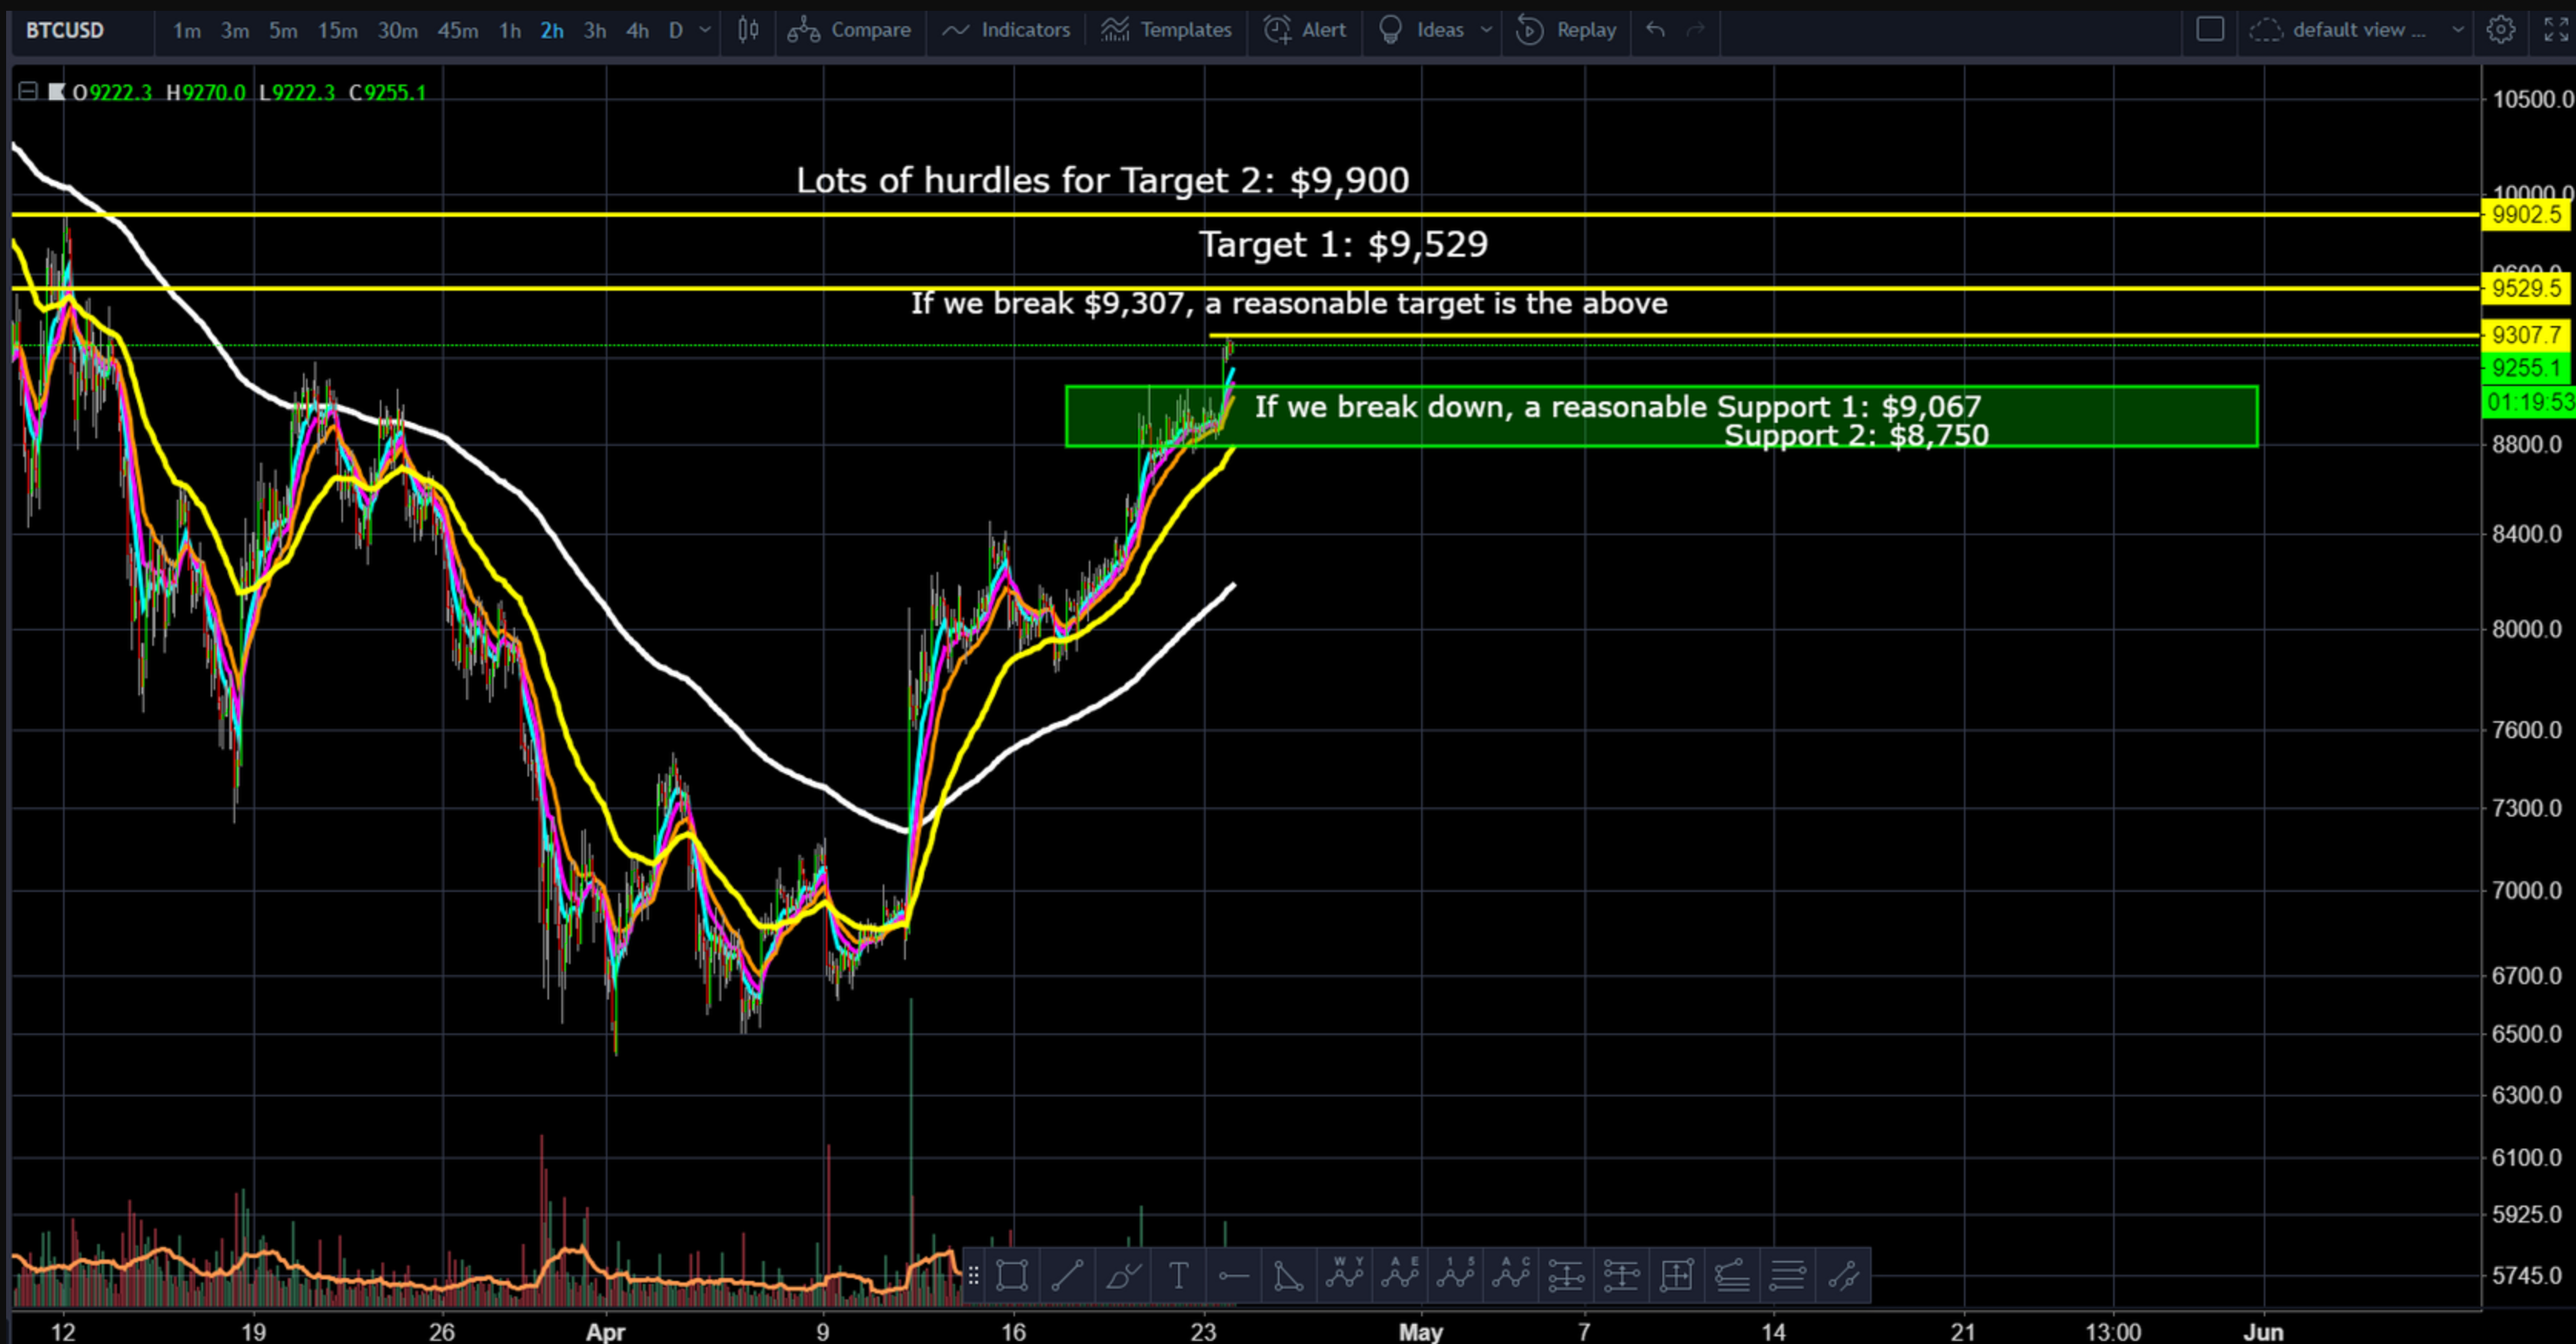
Bullish scenario got confirmed. Possible further small wave up to come. See bull/bear scenarios below.
@passion-ground:

Though clearly wrong previously as to the level and extent of upside momentum inherent in the recent bullish thrust higher, it now, however, seems that a short-term interim pivot high may have finally established itself. Looking for some further downside from here and then very much counting on another bull run equal to or preferably surpassing the amplitude of the most recent run-up in terms of both time and price.

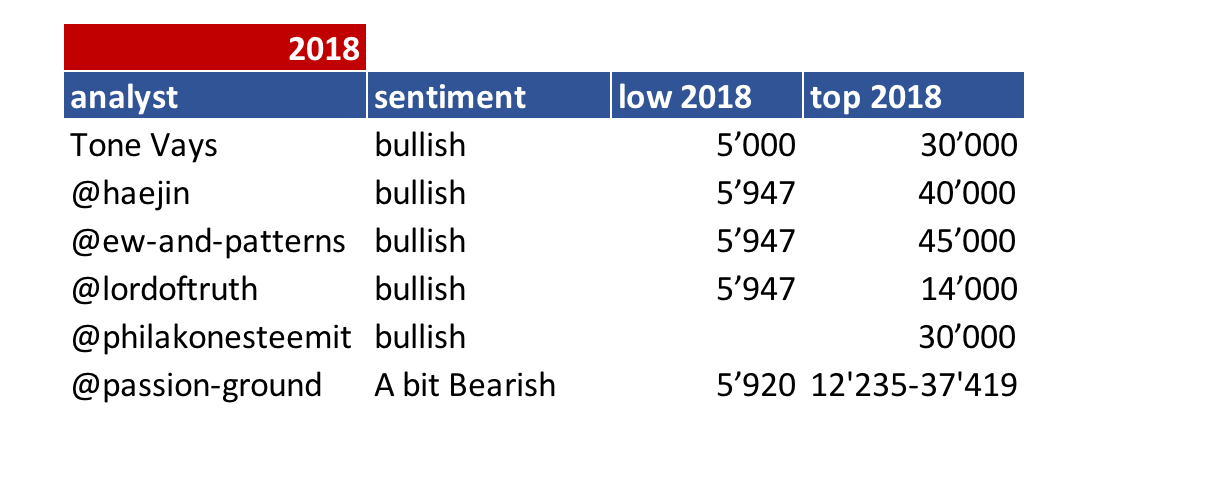
Summary of targets/support/resistance

Reference table
| analyst | latest content date | link to content for details |
|---|---|---|
| Tone Vays | 27. Apr | here |
| @haejin | 28. Apr | here |
| @ew-and-patterns | 26. Apr | here |
| @lordoftruth | 28. Apr | here |
| @philakonesteemit | 24. Apr | here |
| @passion-ground | 26. Apr | here |
Definition
- light blue highlighted = all content that changed since last update.
- sentiment = how in general the analysts see the current situation (bearish = lower prices more likely / bullish = higher prices more likely)
- target = the next (short term) price target an analysts mentions. This might be next day or in a few days. It might be that an analyst is bullish but sees a short term pull-back so giving nevertheless a lower (short term) target.
- support/res(istance) = Most significant support or resistances mentioned by the analysts. If those are breached a significant move to the upside or downside is expected.
- bottom = -> now renamed and moved to long term table. Low 2018
- low/top 2018 = what is the low or the top expected for 2018?
Further links for educational purposes:
- From @ToneVays: Learning trading
- From @philakonecrypto: Like in every post you find links to his amazing educational videos. For example here
- From @lordoftruth: Fibonacci Retracement
- From @haejin: Elliott Wave Counting Tutorial
*If you like me to add other analysts or add information please let me know in the comments.
