
I have optimized my previous forecasting model, and made it at least +852.58% more efficient and accurate both on old as on new data. And although the old model is good and profitable too, this one is just way better. Let's see how the new model named PROFIT GENERATOR II. behaves and how accurately it forecasts the BTC/USD price.
This was the PROFIT GENERATOR I. previous model: @profitgenerator/the-profit-generator-scientific-btc-usd-forecasting-model
THE PROFIT GENERATOR II.
This one is similarly, based on Blockchain.info's price feed, so if you decide to use it, make sure that your exchange's price feed is in synch with their price. It should be daily CLOSE price at 00:00 UTC time.
We have a Mean Absolute Percentage Error of only 5.6362, I am using this measurement as my primary measurement tool, since it measures the error unbiased, and it's not distorted by the arithmetic price distances that may be bigger or smaller on average depending on the time section. Besides we measure the profits & losses in percentages as well, so it fits better for our purposes.
If the MAPE is small it means that the axis of the forecast (in a dynamic forecast) aligns better with the local mean of the future price, and it can be used more accurately in "bounce-back trading". Needless to say that the MAPE of PROFIT GENERATOR I. was bigger and it was less good for that particular strategy.
- I also use other benchmarks to know if a model is good or not, one of them is testing the normality of the residuals:
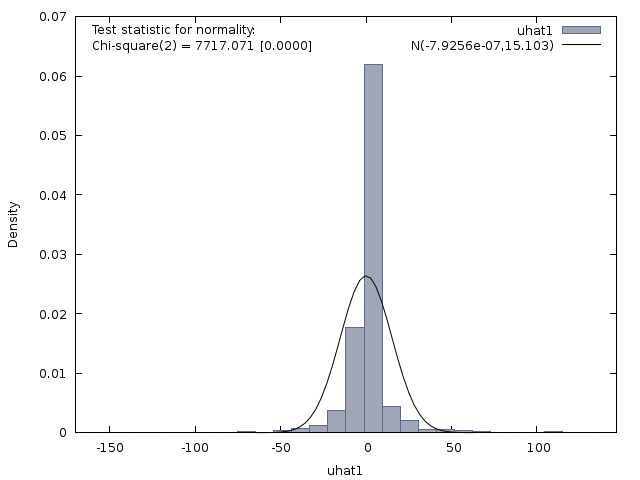
Chi-square(2) = 7717.071 shows a higher normality. It is higher than for PROFIT GENERATOR I.
An autocorrelation test: Ljung-Box Q = 595.693, with a p-value of 2.402e-72. The residuals are not autocorrelated. It also shows better results than PROFIT GENERATOR I.
I have performed many more tests, and compared it to PROFIT GENERATOR I. , in every shape and form the II. version beats the first one, and its pretty much better at every benchmark test. So the II. version will replace now my main model to forecast the BTC/USD price.
Trading Strategy
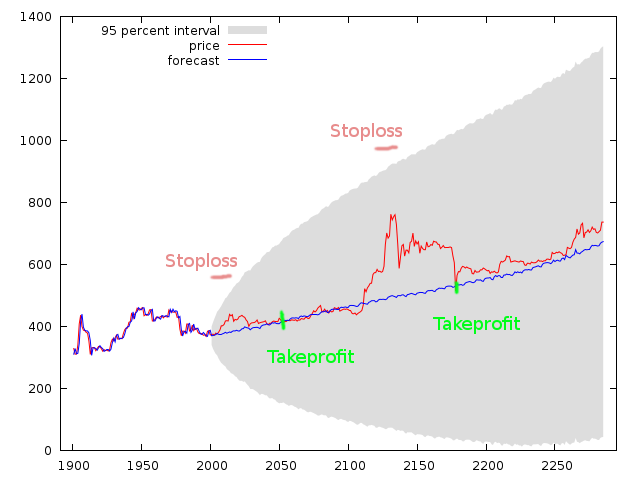
Multiple trading strategies could work, but my calculations showed that a bounce-back strategy would be the most reliable. Many of you who are traders are familiar with things like Bollinger Bands. This strategy would be similar, except that we are doing in more accurately by trading on bounce-backs from the extreme confidence interval points.
You can test the parameters yourself, I will leave it up to you, it has positive expectancy either way so it doesn't matter what parameters you choose, but it should be configured according to your risk management.
- Example: We have 100$ capital, we risk 5% of the account/trade, we buy/sell at bounce-backs from the 60% confidence level, and put the stoploss (SL) outside the 95% confidence level (+ another 5.6362% distance to account for the error). Then we set the leverage accordingly, and the distance between the price and the SL + 5.6362% distance should be a 5% loss to our account. So if the SL gets hit we only lose 5% of our account. We take the profit (TP) based on this info to create an artificial positive EV:
EV = TP * WIN_PROBABILITY - SL * LOSS_PROBABILITY
EV = TP * 95% - (SL+SL*5.6362/100) * 5%
EV= 0.95 * TP - 0.0528181 * SL
Then after you know the size of the SL in pips / basis points or whatever price measurement unit you use, you choose the TP, in order for the EV to be greater than 0. The EV or expected value must be bigger than 0, EV* NR_TRADES will be essentially your profit minus the commissions/taxes you would pay.
For sake of simplicity the forecasted mean could be used as the TP distance, let me illustrate:
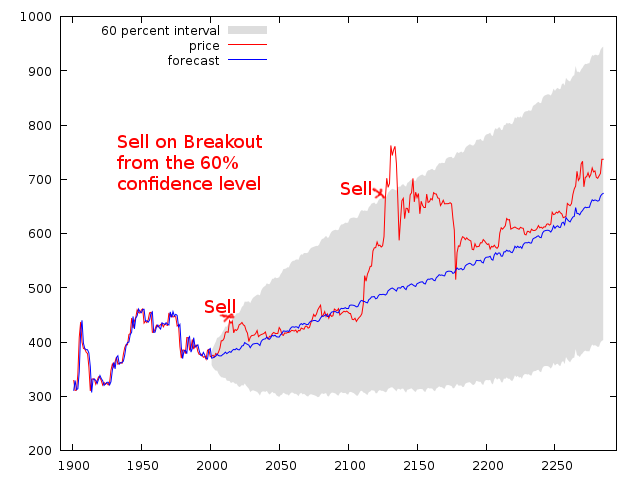
But of course you can use any strategy you want based on your risk appetite and style of trading. This illustration would have resulted in a +12% profit and a +30% profit trade and no losses in this particular timezone. Also this strategy would apply to longer term trades, so you would have less trades with probably higher accuracy and bigger risk & reward, you would probably need a larger account to absorb the losses that may occur from time to time.
Pricing
The strategy itself still costs 100 Bitcoins, if you want to buy it, please contact me at
alexander87@protonmail.com, and we can negotiate. I accept escrow, and I will give full support on how to set it up and start forecasting with it. You will need some basic statistical knowledge to be able to do this, I am not providing mathematical/statistical education.I will also start a paid forecasting service, where I will forecast the BTC/USD price. You can then buy the forecasted future price information for a small fee for the next 7 days. To test the accuracy of the service, the next 2 weeks of forecast is FREE, so you can check out my accuracy.
Here is the BTC/USD forecast for the next 7 days for FREE!
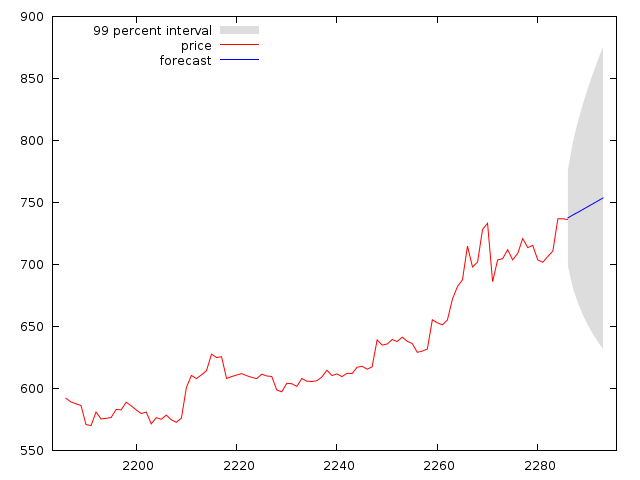
| Date | Forecasted Mean | 99% Confidence Interval |
|---|---|---|
| November 18, 2016 | $737.5965 | 698.760718 - 776.432189 |
| November 19, 2016 | $739.9585 | 681.033519 - 798.883556 |
| November 20, 2016 | $742.1698 | 668.953747 - 815.385893 |
| November 21, 2016 | $744.4564 | 659.246143 - 829.666599 |
| November 22, 2016 | $746.7558 | 651.052518 - 842.459155 |
| November 23, 2016 | $749.0647 | 643.908874 - 854.220617 |
| November 24, 2016 | $751.3767 | 637.550792 - 865.202666 |
| November 25, 2016 | $753.6892 | 631.808412 - 875.570080 |
Disclaimer: The information provided on this page might be incorrect. I am not responsible if you lose money using the information on this page! This is not an investment advice, just my opinion, research and analysis for educational purposes.
Upvote, ReSteem &