
Bienvenidos ~ Welcome

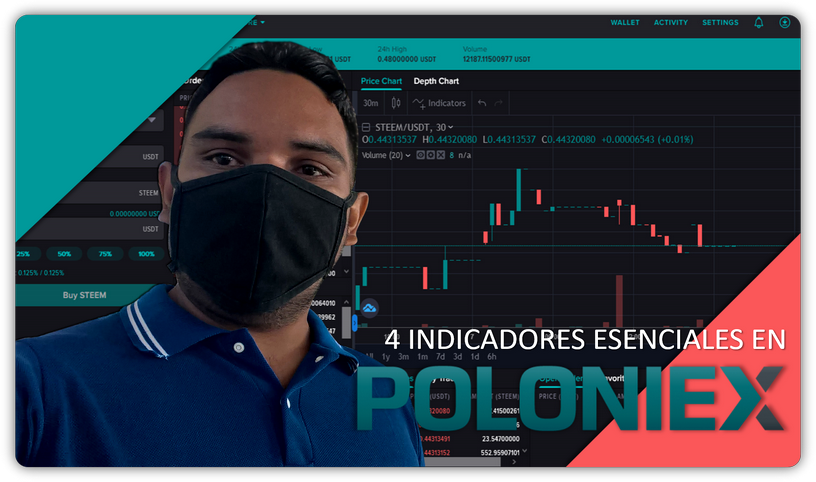
Saludos steemians, he estado trabajando en el mercado de poloniex y me ha resultado bastante interesante, ya que me permite hacer pares que en otros mercados no puedo sin embargo esta publicación tratara el tema de los indicadores y sus funciones acá les hablaré de 4 indicadores que son clave a la hora de trabajar en el mundo de las criptomonedas.
La mayoría de los traders y analistas profesionales usan indicadores que les facilitan identificar patrones de ventas y compras spot en los diferentes mercados, en la actualidad hay muchísimos tipos sin embargo hablaré de los que considero los más utilizados.
Greetings steemians, I have been working in the poloniex market and I have found it quite interesting, as it allows me to make pairs that in other markets I can not however this publication will address the issue of indicators and their functions here I will talk about 4 indicators that are key when working in the world of cryptocurrencies.
Most traders and professional analysts use indicators that help them identify patterns of sales and purchases spot in different markets, there are currently many types but I will talk about what I consider the most used.
Translated with www.DeepL.com /Translator

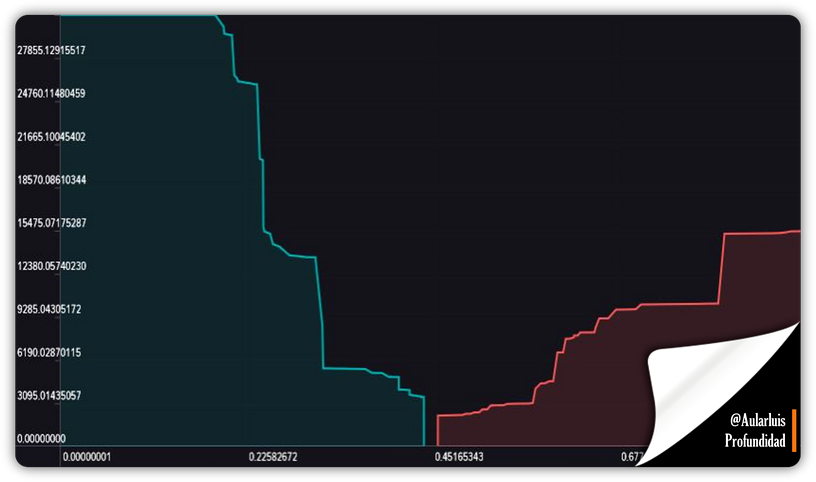
Es uno de mis gráficos favoritos, ya que puedo tener una perspectiva de como se encuentran las ventas y compras de un activo y el número de ofertas en el mercado conociendo esto podemos predecir una posible tendencia.
ya que la lógica nos indica que al tener muchas ventas y pocas compras el precio del activo es probable que descienda en cambio en una situación contraria el precio de nuestro activo es más probable que aumente, sin embargo ninguno de los indicadores es 100% certero y pueden brindar falsas señales, lo mejor es observar el comportamiento del mercado e ir observando sus tendencias por medio de la gráfica de profundidad.
It is one of my favorite charts, since I can have a perspective of how the sales and purchases of an asset and the number of offers in the market are, knowing this we can predict a possible trend.
since logic tells us that having many sales and few purchases the price of the asset is likely to fall in contrast in an opposite situation the price of our asset is more likely to increase, however none of the indicators is 100% accurate and can provide false signals, it is best to observe the behavior of the market and observe its trends through the depth chart.
Translated with www.DeepL.com /Translator

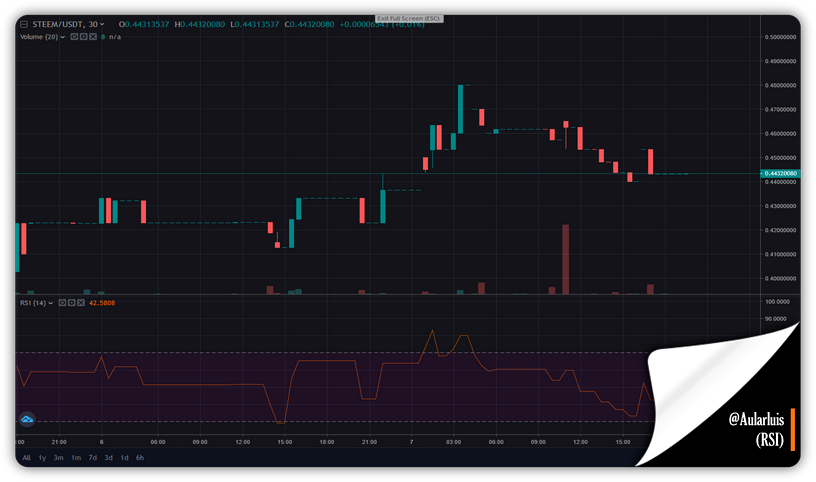
Es el indicador de momento y es el que más uso, ya que el mismo me permite saber cuándo una criptomoneda esta sobre vendida o sobre comprada. Esto lo logra midiendo las magnitudes en los cambios de los precios más actuales o recientes. Nuestros datos nos muestran una gráfica que se mueve entre valores de 0 a 100 sin embargo, esta preconfigurada entre 30 y 70.
Si interpretamos estos datos podríamos decir lo siguiente al tener valores por encima del 70 un activo esta sobrecomprado de manera tal que si esta por debajo del 30 esta sobrevendido. Esto nos indica que pronto seremos testigos de un cambio de tendencia o “pullback”, claro esto no es 100% infalible por lo que es bueno tener otras técnicas de análisis a disposición para poder tomar decisiones, ya que muchas veces estos valores podrían ser engañosos.
It is the indicator of the moment and is the one I use the most, since it allows me to know when a cryptocurrency is oversold or overbought. It does this by measuring the magnitudes in the most current or recent price changes. Our data shows us a graph that moves between values from 0 to 100, however, it is preset between 30 and 70.
If we interpret this data we could say the following when having values above 70 an asset is overbought in such a way that if it is below 30 it is oversold. This indicates that we will soon witness a change of trend or "pullback", of course this is not 100% infallible so it is good to have other analysis techniques available to make decisions, as often these values could be misleading.
Translated with www.DeepL.com /Translator

Este indicador lo podemos definir como un indicador de precios pasados o atrasados, ya que el mismo toma las acciones de los precios del mercado y nos muestra la dirección de tendencia. Sus formas más habituales son (SMA o MA) Media Móvil Simple y (EMA) La Media Móvil Exponencial.
Mientras que la SMA toma en consideración los precios en el mercado de los últimos 10 días el EMA se concentra en los precios más actuales. Usualmente a la hora de hacer un estudia podemos tomar valores de D200 (200 días) con el SMA para concluir que el precio de un activo se encuentra en tendencia alcista siempre y cuando estos valore se mantenga por encima del último soporte.
This indicator can be defined as an indicator of past or lagging prices, since it takes the market price actions and shows the trend direction. Its most common forms are (SMA or MA) Simple Moving Average and (EMA) Exponential Moving Average.
While the SMA takes into consideration the market prices of the last 10 days, the EMA concentrates on the most current prices. Usually at the time of making a study we can take values of D200 (200 days) with the SMA to conclude that the price of an asset is in an uptrend as long as these values remain above the last support.
Translated with www.DeepL.com /Translator

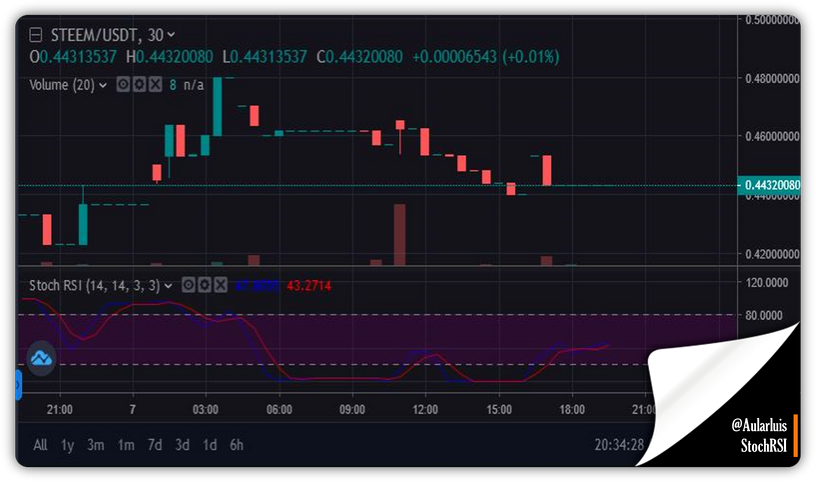
Este indicador se crea a partir de datos obtenidos del RSI aplicando una fórmula conocida como la fórmula del oscilador estocástico a los valores RSI normales, estos valores oscilan entre 0 y 1 o entre 0 y 100. Al igual que el RSI nos permite saber si un activo esta sobre comprado cuando supera los 0.8 o sobre vendido cuando desciende por debajo de los 0.2 respectivamente.
Solo que debes tener cuidado, ya que este indicador es mucho más sensible debido a su mayor velocidad lo que como consecuencia puede generar señales falsas, en general es más práctico usar este indicador cuanto está en sus extremos superiores o inferiores de su rango.
This indicator is created from data obtained from the RSI by applying a formula known as the stochastic oscillator formula to the normal RSI values, these values range between 0 and 1 or between 0 and 100. Like the RSI allows us to know if an asset is overbought when it exceeds 0.8 or oversold when it falls below 0.2 respectively.
Only you must be careful, since this indicator is much more sensitive due to its higher speed which as a consequence can generate false signals, in general it is more practical to use this indicator when it is in its upper or lower extremes of its range.
Translated with www.DeepL.com /Translator
Puedes visitar mis otros posts y en el de Word enseño como agregar Sniper para facilitar el uso de códigos en Word.

 |
 |
 |
|---|

Tambien Puedes Visitar

|

|

|
|---|

