Regular daily update on BTC ta analysts opinions.

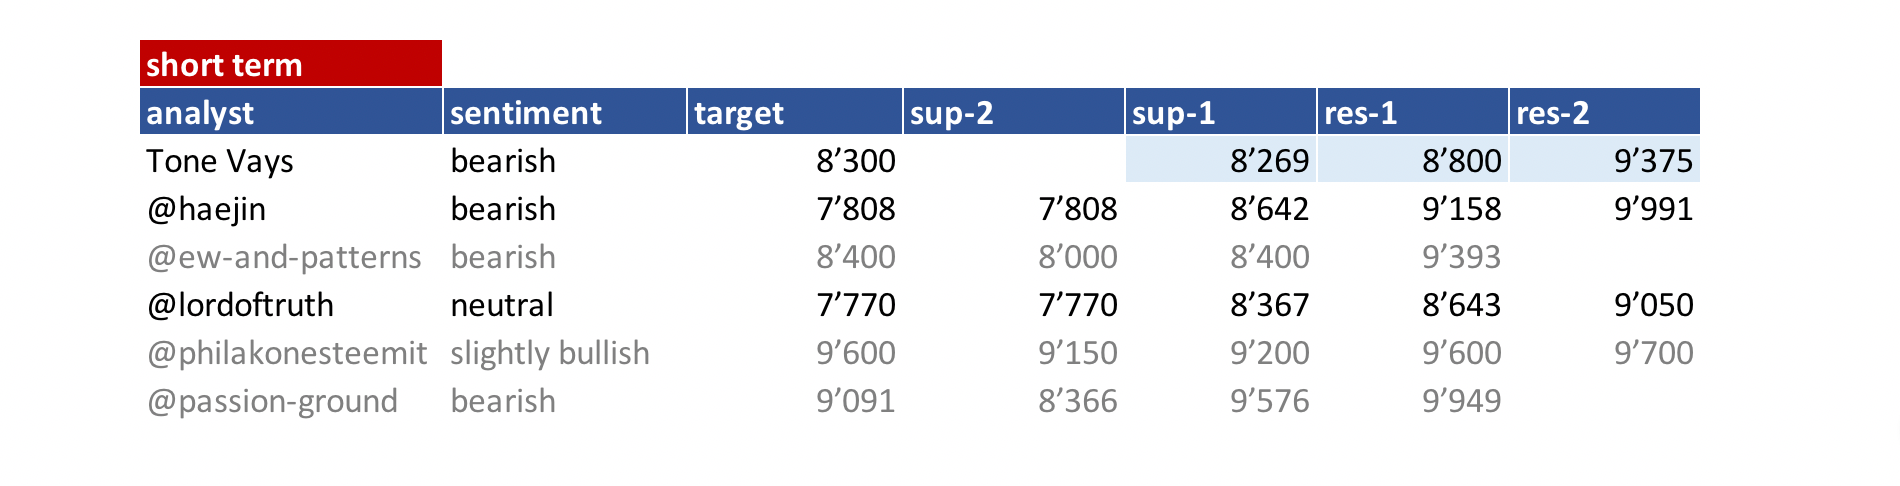
**My summary - short-term sentiment: bearish ** (last: bearish)

We going back down as expected by analysts.
Found support for the moment 8'100.
Still more downside expected by most analysts. 7'700 - 7'500 is expected.
@ew-and-patterns sees us going up from here.
May is usually a strong month. Lets see how it plays out in 2018.
News about the blog
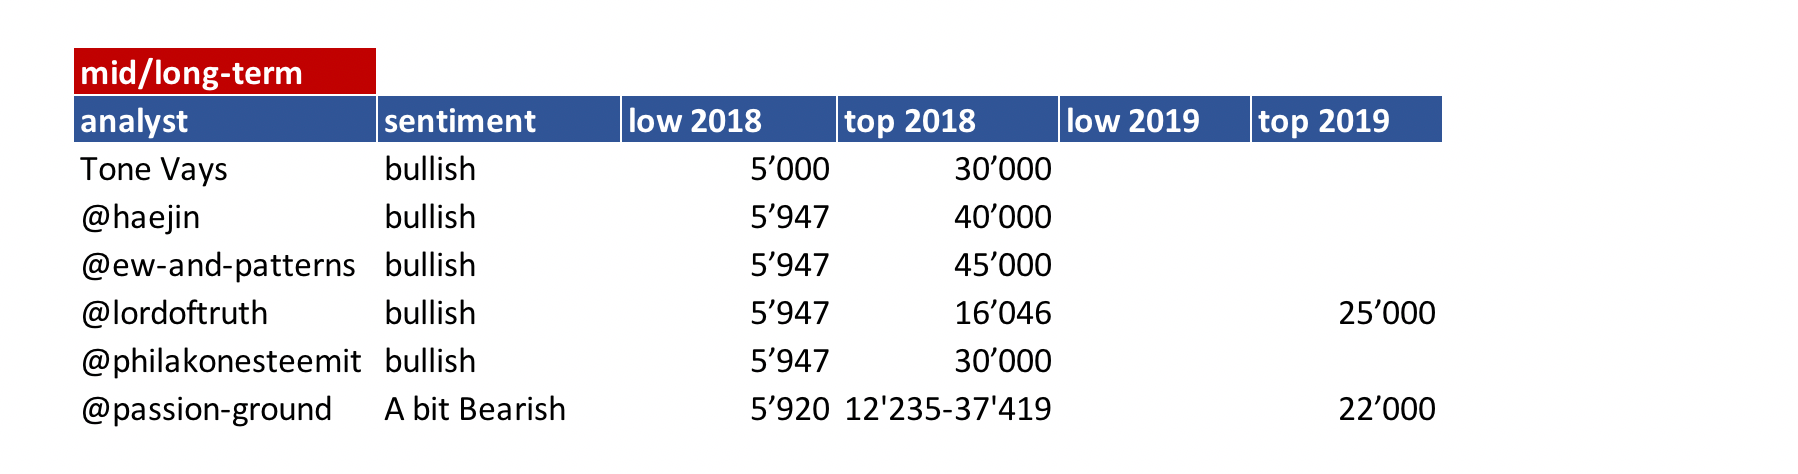
I need to revise my 2018 long term table. I need to add a 2018 and 2019 target an be more precise on the sentiment here. Will do that after I am back in Switzerland.
We lunched the bounty project beta. If you are interested and you like to create a bounty on your own have a look at this post
Analysts key statements:
Tone:
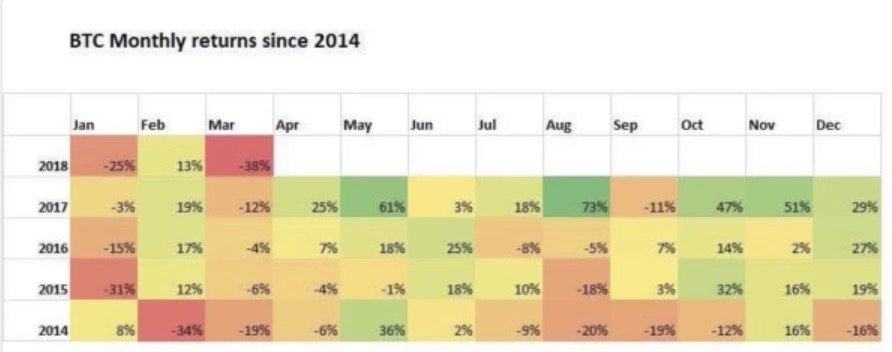
- Weekly: Price is starting to pull back a bit. No trade zone. Zooming out it looks still very bearish. Similarity to 2014 ist strong. He expects a narrow green/red candle than 2 weeks positive and than "desaster" sets in.
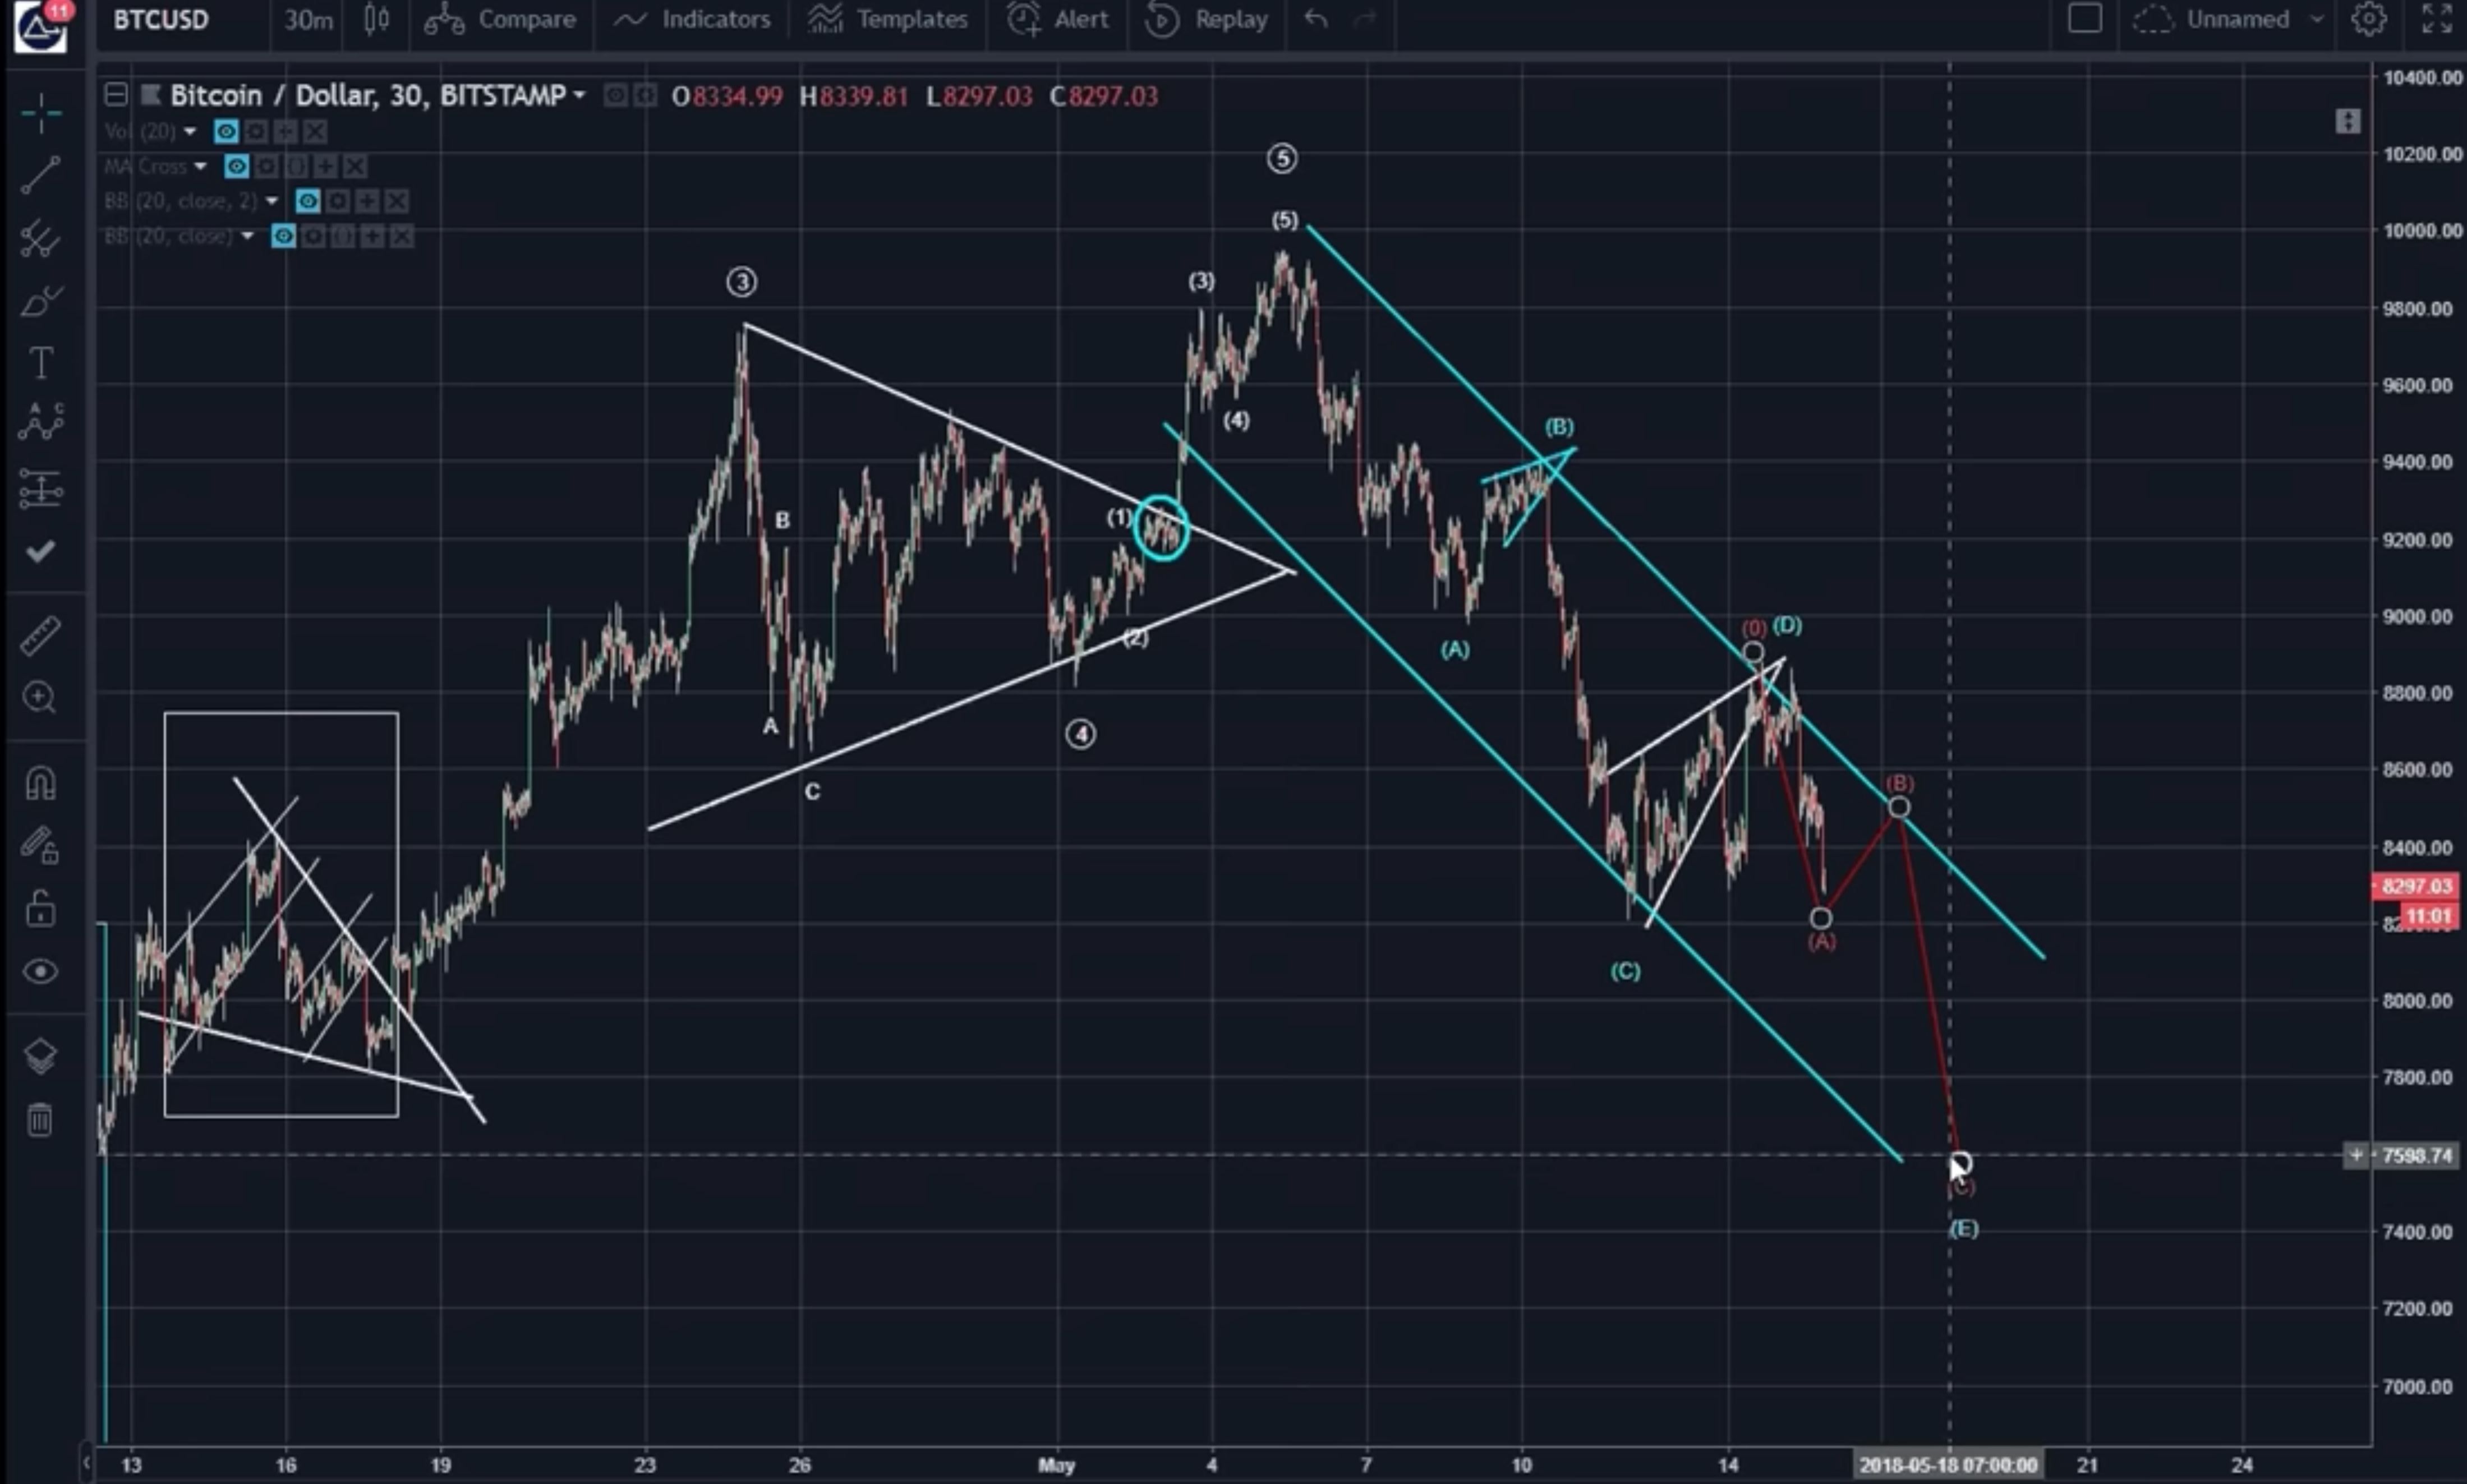
- Daily: Got rejected by hs resistance (8'800) and start to look weak. He expects it to go down further. We won't get a 9 probably.
@haejin:
He expects a "E" leg down toward 7'700. Which he sees as normal retracement after the move up. Going down this E in a ABC A 8'100, B 8'450, C 7'500.
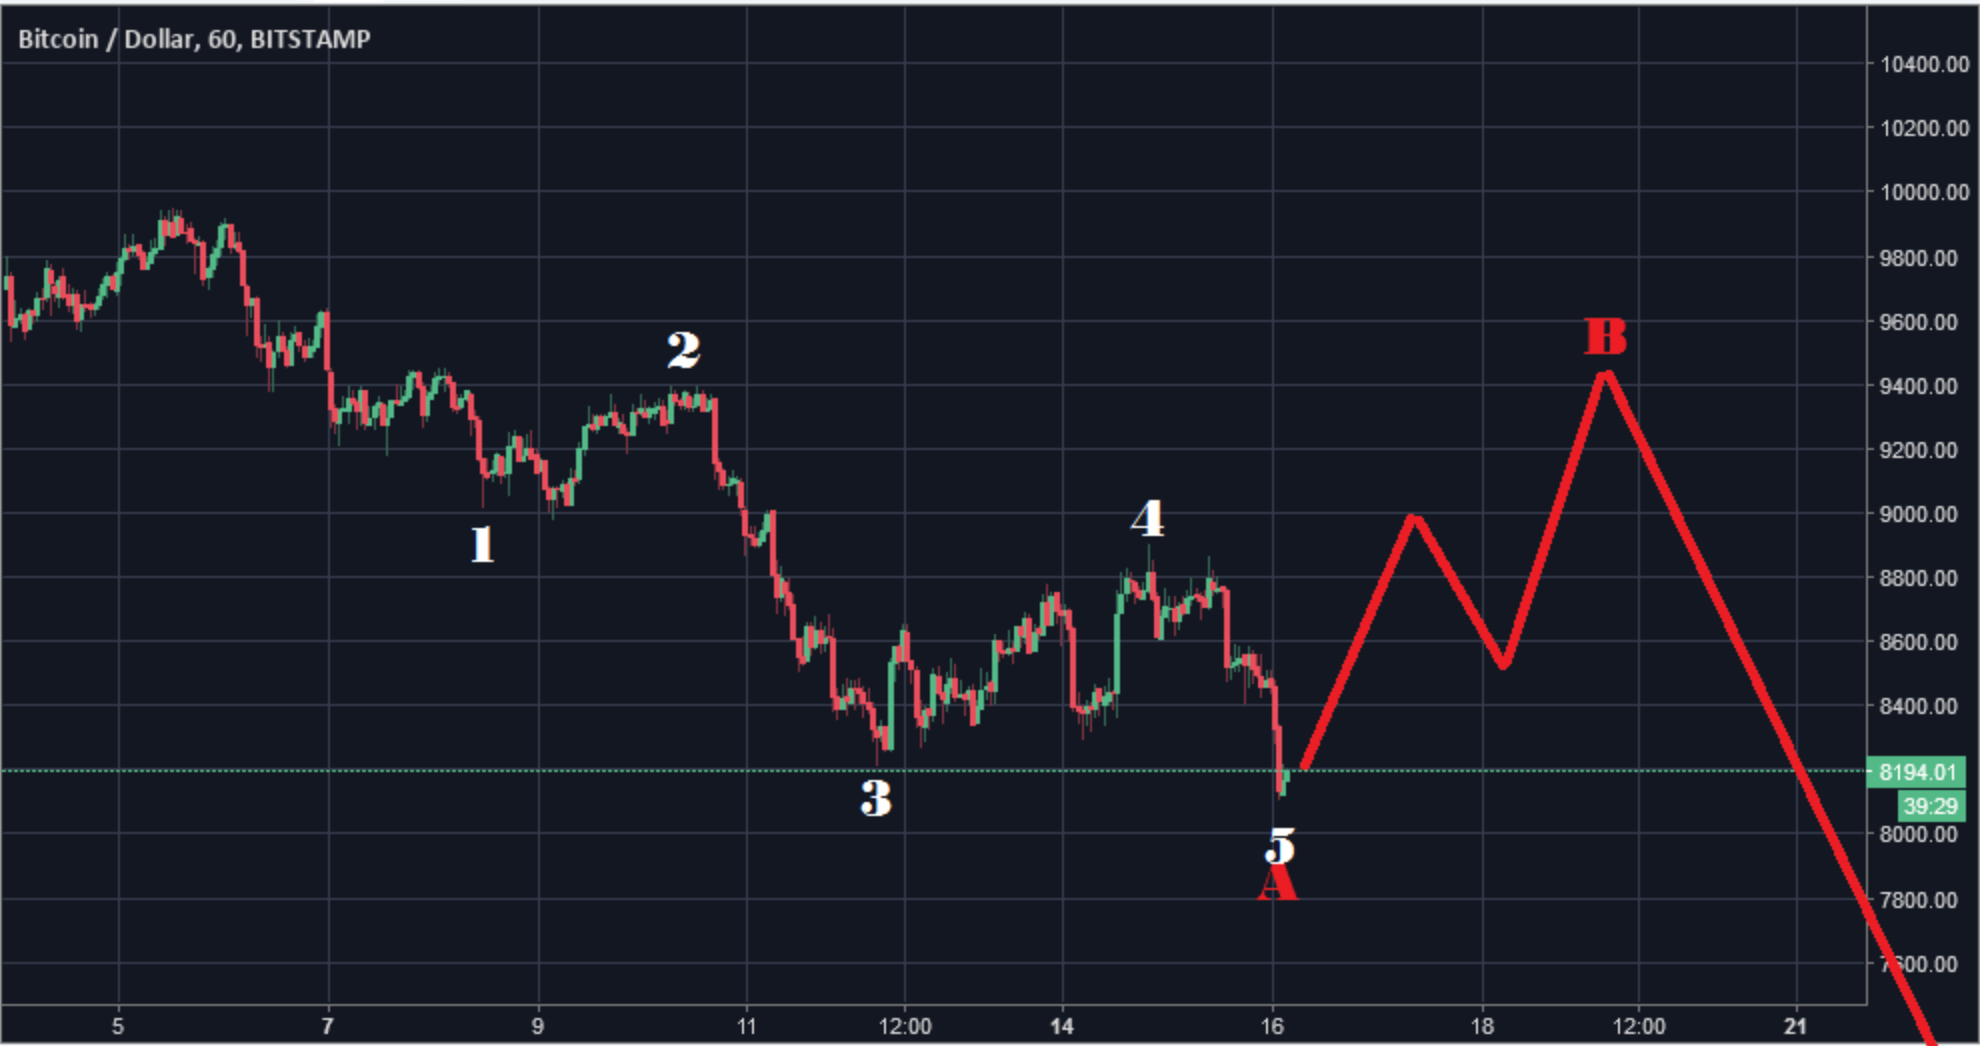
@ew-and-patterns:
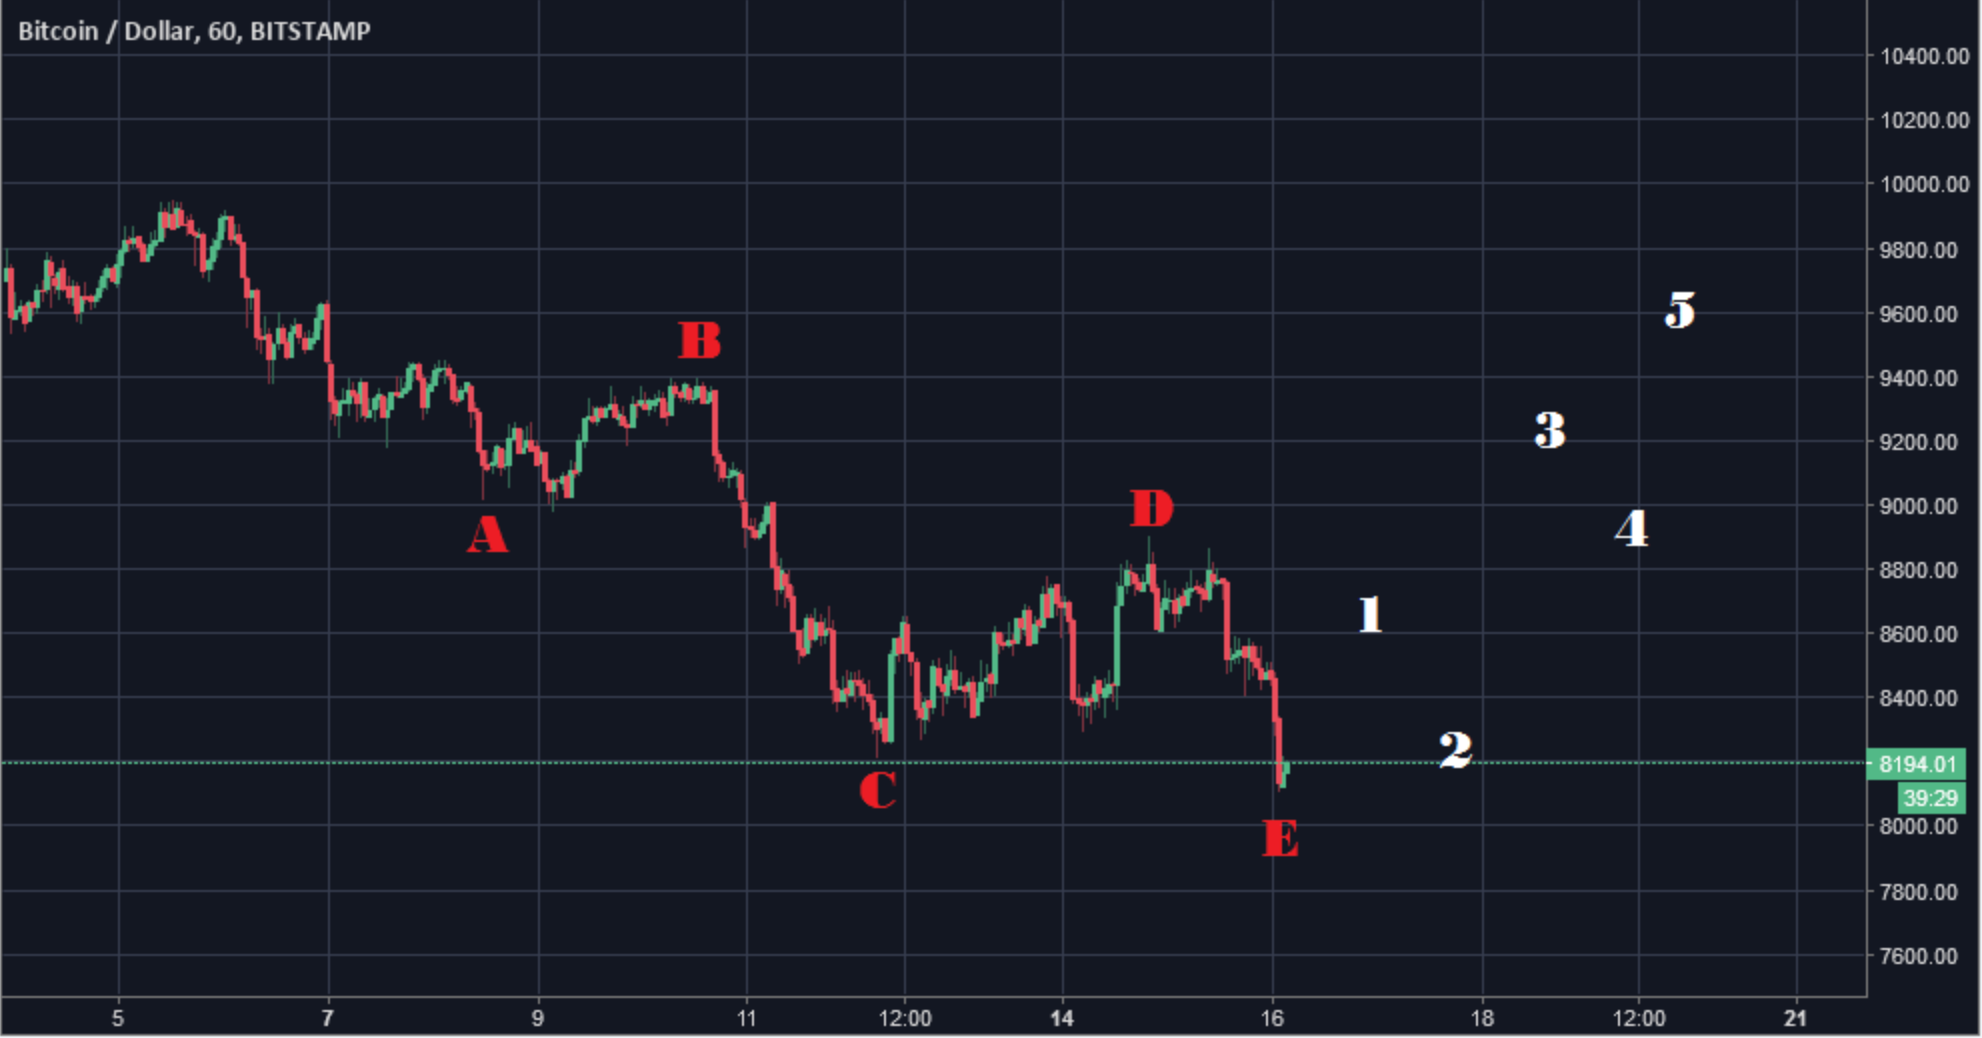
The bearflag pattern was dissolved like in a textbook example. He expects us to go up from here. Now, the further price action will depend on whether we will see 3 waves up or 5 waves up next. If we see 3 waves up, the correction cannot be done yet.
Two scenarios: 3 Waves up (bearish)
5 waves up (bullish)
@lordoftruth:
Based on price behavior of the last days around 8'643 he thinks that downside action should continue to 7'770 to become a right arm of reverse H&S Pattern, before any new attempt to rise.
Scenario will be invalid if market moves above 8'643.
If bitcoin price fail to turn up around 7'770 level also 6'519 low will be broken.
Todays trend is neutral. Trading between 7'770 and 9'050.
@philakonesteemit:

We see a massive rejection at 10'000 range and have now hit a 0.618 golden ratio fibonacci retracement level. I do not believe it'll hold and we can see 9'050 to 9'150 range. If that doesn't hold we go for 8'200 to 8'620 range.
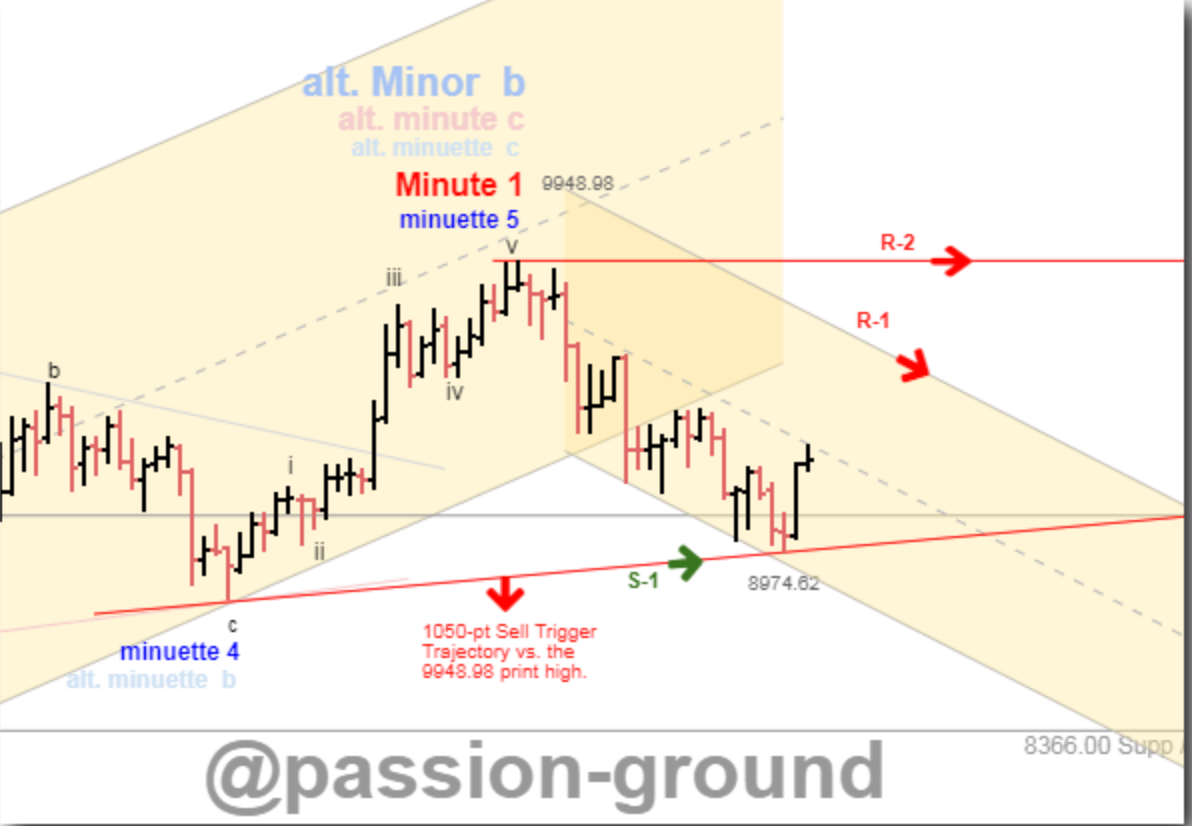
@passion-ground:
If the preferred bullish count is to remain in place, bitcoin could go down as low as 7'887, which is a 0.618 fib retracement of the entire bullish advance from lows printed on April 9th. Short-term trend is down, and the 9'577 level is “key” upside resistance. If crossed we will see a short-term move above the recent print high of 9'948. If 9'577 holds we will see further downside consolidation before next bullish run higher.
Summary of targets/support/resistance
Reference table
| analyst | latest content date | link to content for details |
|---|---|---|
| Tone Vays | 15. May | here |
| @haejin | 16. May | here |
| @ew-and-patterns | 16. May | here |
| @lordoftruth | 16. May | here |
| @philakonesteemit | 07. May | here |
| @passion-ground | 10. May | here |
Definition
- light blue highlighted = all content that changed since last update.
- sentiment = how in general the analysts see the current situation (bearish = lower prices more likely / bullish = higher prices more likely)
- target = the next (short term) price target an analysts mentions. This might be next day or in a few days. It might be that an analyst is bullish but sees a short term pull-back so giving nevertheless a lower (short term) target.
- support/res(istance) = Most significant support or resistances mentioned by the analysts. If those are breached a significant move to the upside or downside is expected.
- bottom = -> now renamed and moved to long term table. Low 2018
- low/top 2018 = what is the low or the top expected for 2018?
Further links for educational purposes:
- From @ToneVays: Learning trading
- From @philakonecrypto: Like in every post you find links to his amazing educational videos. For example here
- From @lordoftruth: Fibonacci Retracement
- From @haejin: Elliott Wave Counting Tutorial
*If you like me to add other analysts or add information please let me know in the comments.