Summary:
The Gantt graph is a graphical representation of the sequence and duration of any particular project by the activity list and the time scale. Now i will show you how to use typora to create a Gantt chart.
甘特图又叫横道图,它是以图示的方式通过活动列表和时间刻度形象地表示出任何特定项目的活动顺序与持续时间。是一个在时间前进线上拓展的图表,目的是让用户能够直观的在时间概念上了解事件推进进度。
1.对typora进行设置,让它支持我们即将使用的gantt语句
typora集成了很多模块,因此其实不仅仅可以绘制流程图,在我们绘制流程图之前,先确认下识别flow语句的引擎有没有打开,不然没办法绘制流程图。点击“file”文件菜单,选择“preferences”个人选项。在弹出的窗口,找到Syntax support(语法支持),勾选 Diagrams(图表).

2.mermaid语句
首先我们先看下mermaid语句的基本格式,如下:
````mermaid //开头是英文状态下的三个顿号
gantt
dateFormat YYYY-MM-DD
title Steemit.wang上线计划
section 第一分工
数据库设计 :active, p1, 2017-08-15, 50d
详细设计 : p2, after p1, 20d
section 第二分工
后端开发 : p3, 2017-08-22, 20d
前端开发 : p4, 2017-08-22, 15d
section 第三分工
功能测试 : p6, after p3, 50d
测试上线 : p7, after p6, 20d
正式上线 : p8, after p7, 20d
```` // 结尾 就像html语句一样 <html>……</html>
显示结果如下:

格式讲解:
gantt
dateFormat  YYYY-MM-DD
title name
这三个很好理解,第一个是甘特图定义,第二个是 时间格式(因为甘特图是以时间推进,所以需要设置时间格式)。第三个是这个甘特图的标题,name部分可以任意设置。
section name
这个是指阶段。如果在时间线上同时有几个事件在推进,就需要设置多个section。name部分可以任意设置。
name :active, p1, 2017-08-15, 50d
active代表当前部分是正在完成中,也就是事件的状态,p1是为事件定义的变量名,2017-08-15是开始时间,50d是需要花费的时间。name部分可以设置任意内容。
name :active , p2, after p1, 20d
如果不想设置初始时间,紧接着上面一个事件设置,可以使用after ,意思就是事件是接p1事件,但同样需要设置花费时间。
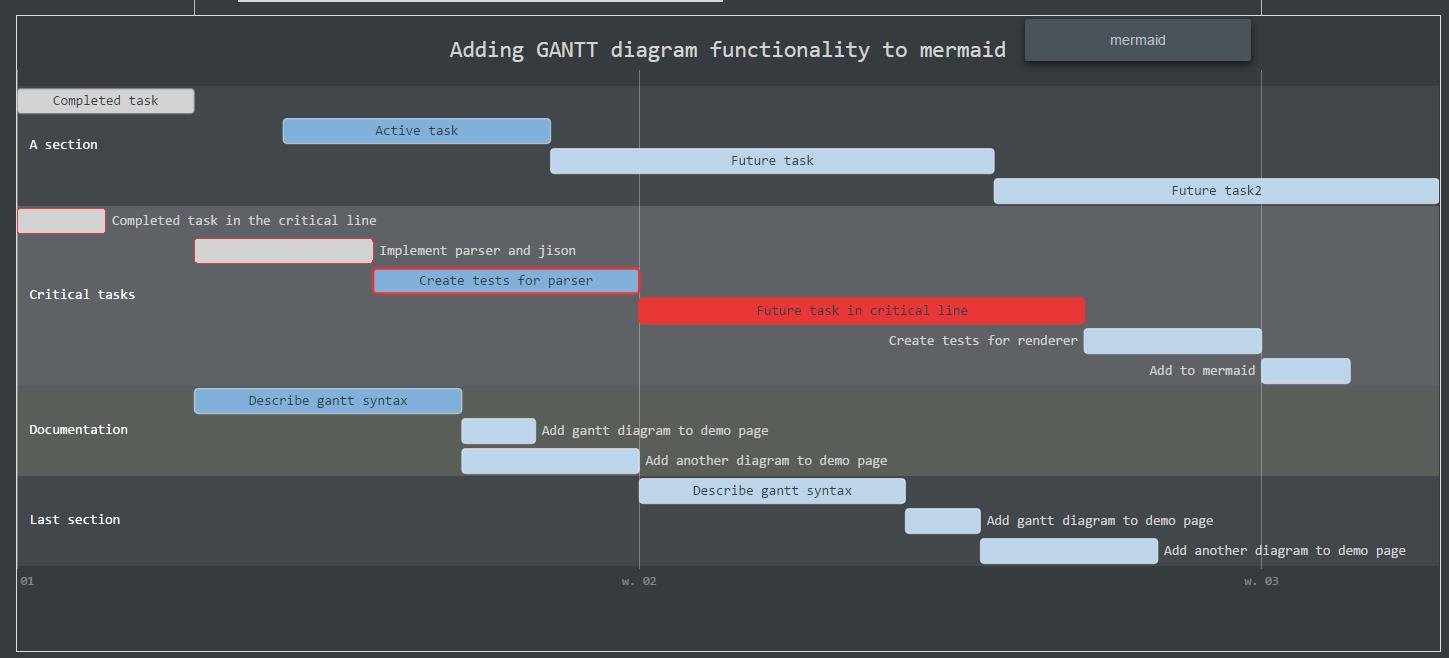
下面看下一个比较复杂的例子:
    gantt
    dateFormat  YYYY-MM-DD
    title Adding GANTT diagram functionality to mermaid

    section A section
    Completed task            :done,    des1, 2014-01-06,2014-01-08
    Active task               :active,  des2, 2014-01-09, 3d
    Future task               :         des3, after des2, 5d
    Future task2               :         des4, after des3, 5d

    section Critical tasks
    Completed task in the critical line :crit, done, 2014-01-06,24h
    Implement parser and jison          :crit, done, after des1, 2d
    Create tests for parser             :crit, active, 3d
    Future task in critical line        :crit, 5d
    Create tests for renderer           :2d
    Add to mermaid                      :1d

    section Documentation
    Describe gantt syntax               :active, a1, after des1, 3d
    Add gantt diagram to demo page      :after a1  , 20h
    Add another diagram to demo page    :doc1, after a1  , 48h

    section Last section
    Describe gantt syntax               :after doc1, 3d
    Add gantt diagram to demo page      : 20h
    Add another diagram to demo page    : 48h
显示结果如下:

在上面的例子里面,我们可以看到在描述事件状态的时候,是有三种,第一是空,表示正要推进 ,但未进行到。第二是active,表示正在进行中,第三种 done 表示该事件已经完成。这3个状态只能取一种,一个事件不可能有2个状态。
另外就是 特殊显示,也就是crit 例如:Implement parser and jison :crit, done, after des1, 2d
简单的介绍就到这里,甘特图可以直观告诉我们事件进行状态,方便我们查看进度。很遗憾目前steemit不支持这类markdown图表,如果想发布到steem上面,可以先截图然后上传。
- 使用typora制作序列图/Typora tutorial: Sequence diagram — Steemit
- 使用typora为文章创建目录或者大纲/Typora tutorial :Create a directory or outline — Steemit
- 使用markdonwn编辑器typora制作流程图/Typora tutorial: Draw flow chart with markdown — Steemit
- 使用Typora快速添加markdown格式表格\ Typora tutorial :Create tables easily in MarkDown mode — Steemit
- 使用Typora添加数学公式\ Typora tutorial :mathematical formula — Steemit
About typora
Typora will give you a seamless experience as both a reader and a writer. It removes the preview window, mode switcher, syntax symbols of markdown source code, and all other unnecessary distractions. Replace them with a real live preview feature to help you concentrate the content itself.
Posted on Utopian.io - Rewarding Open Source Contributors
