This is next in my series of posts reviewing the amount and value of powered up STEEM on the Steem blockchain. For previous posts, see the end of this entry.
Noteworthy in the last week,
- Week over week, the number of powered up STEEM decreased by 150K, or just about 1/10%.
- The week saw 4 daily increases and 1 new high in number of STEEM powered up.
- At 41.61%, the series-long high as a percentage of market cap was recorded on April 26. All subsequent observations have been in the 39% range, so this was probably a fluke of timing in the way that CoinGecko updates their market cap and price fields.
- The modeled value of powered-up STEEM lost ground against all comparison tokens except BTC and ETH. Changes ranged from -30% against TRX to +3% against BTC.
- The modeled value of powered-up STEEM lost ground against the USD by about 9%.
- Total power-downs this week totaled 690K STEEM, up by about 5% from last week's 653K.
- In terms of all comparison tokens except for TRX, today's locked value is markedly higher than the January 1, 2022 baseline.
Here are the numbers as-of a few minutes ago:
Total value locked in powered-up STEEM (USD): $61,814,187.42
STEEM market cap $156,723,944.24
Locked value in terms of other tokens:
| token | price | locked value equivalent | Jan 1, 2022 | pct of Jan 1 baseline |
|---|---|---|---|---|
| tron | $0.09 | 706,730,548 | 809,173,538 | 87.34% |
| steem-dollars | $3.65 | 16,935,393 | 11,284,131 | 150.08% |
| bitcoin | $34,585.00 | 1,787 | 1,300 | 137.50% |
| ethereum | $2,569.59 | 24,056 | 16,501 | 145.79% |
| litecoin | $94.72 | 652,599 | 411,561 | 158.57% |
| steem | $0.40 | 156,462,698 | 142,930,214 | 109.47% |
| USD | $1.00 | 61,814,187 | 61,837,042 | 99.96% |
And here are the charts, based on data collected daily since April 10, 2021.
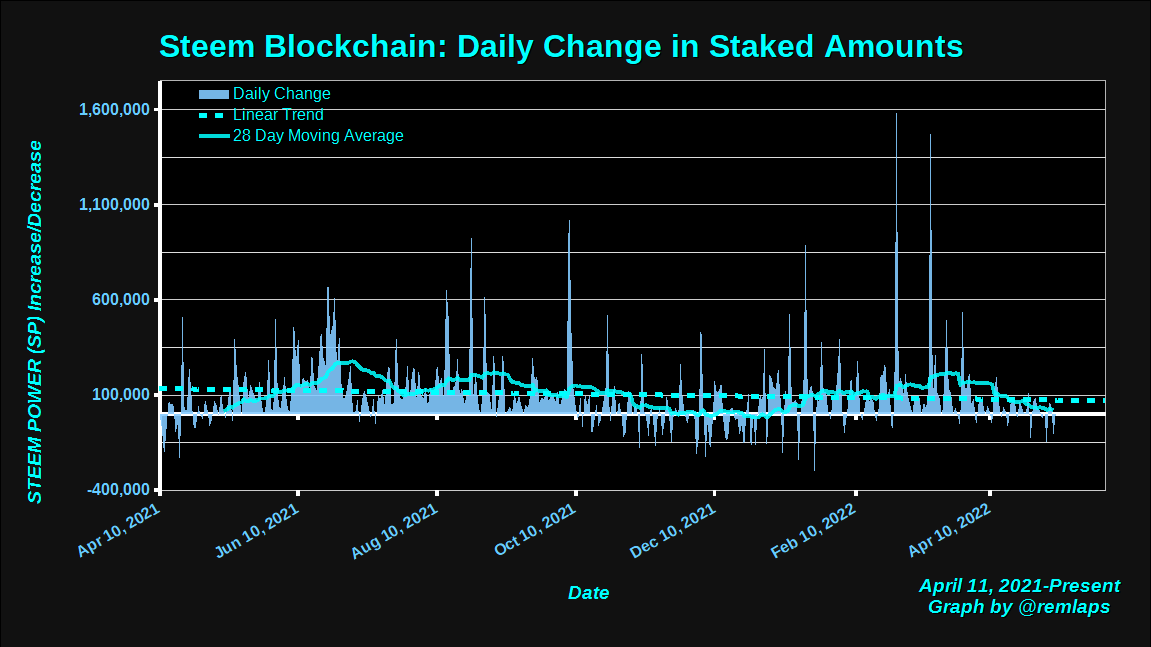
Daily Changes
Here is a chart of daily changes in powered-up STEEM from April 11, 2021 to present. The graph also includes a linear trend line and a 28 day moving average.
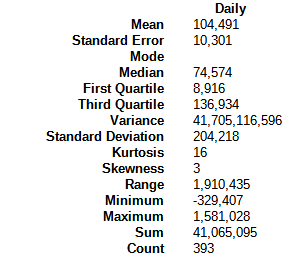
Here are some descriptive statistics, for numbers geeks.
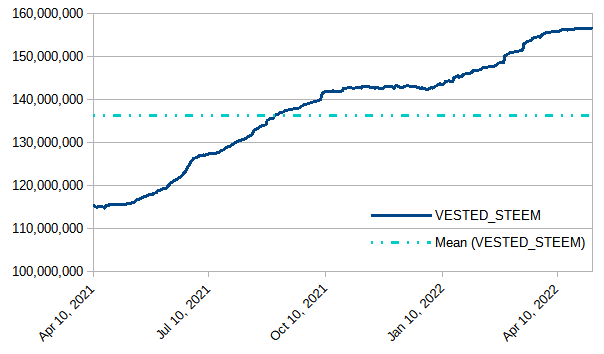
VESTED STEEM
With a decline of about 150k, this was the first weekly decline in quite some time.
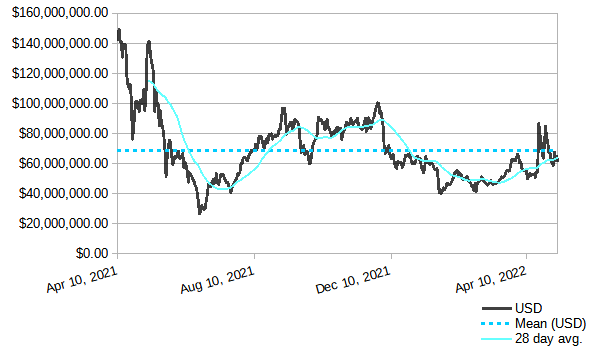
Modeled value of powered-up STEEM in terms of USD
In terms of USD, we saw a weekly decrease of about 6 million dollars, or 9%. Despite the downturn, this was slightly better than the market at large for the week. The value is slightly below its series-long average value.
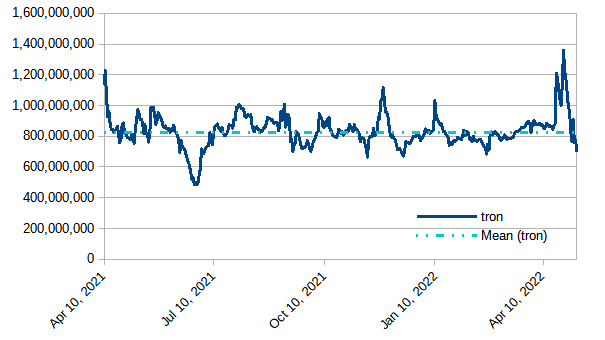
Modeled value of powered-up STEEM in terms of Tron (TRX)
Despite an overall market downturn, TRX has had some good days, gaining strength against powered-up STEEM by 300 million tokens or 30%.
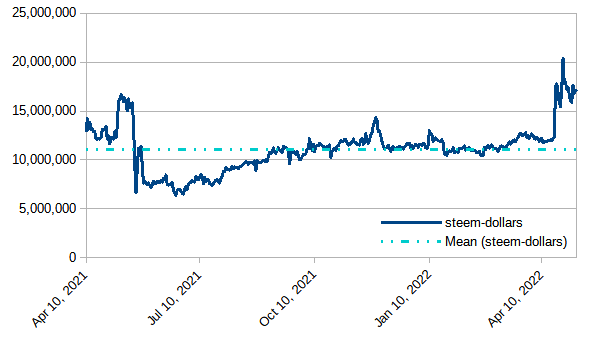
Modeled value of powered-up STEEM in terms of Steem Dollars
Down by about 400K or just shy of 2 1/2%
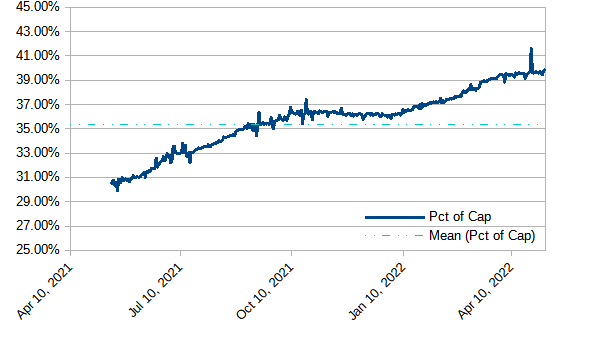
Modeled value of powered-up STEEM as a percentage of Steem's market cap
Running just slightly above flat for the last four weeks, with an anomalous jump up on April 27. With today's observed value of 39.74%, we have now seen 34 consecutive days above 39%; 67 consecutive days above 38%; 98 consecutive days above 37%; 225 consecutive days above 35%; and 288 straight days above 1/3. After three months of upslope, the graph is now leveling off. Will it hold above 39%? Will it go above 40%?
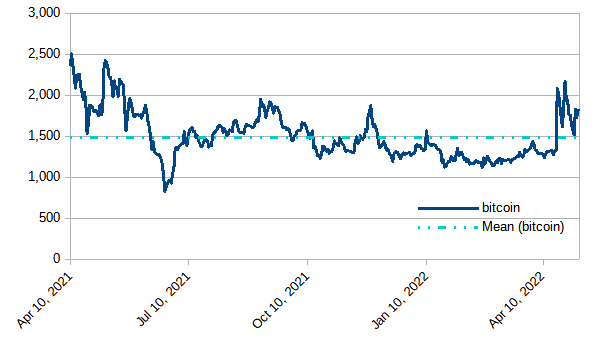
Modeled value of powered-up STEEM in terms of bitcoin (BTC)
Up by about 52 BTC, or 3% during the week.
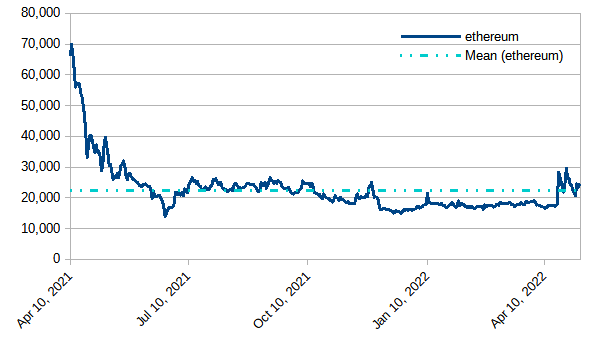
Modeled value of powered-up STEEM in terms of Ethereum
Up by about 350 ETH, or 1 1/2%.
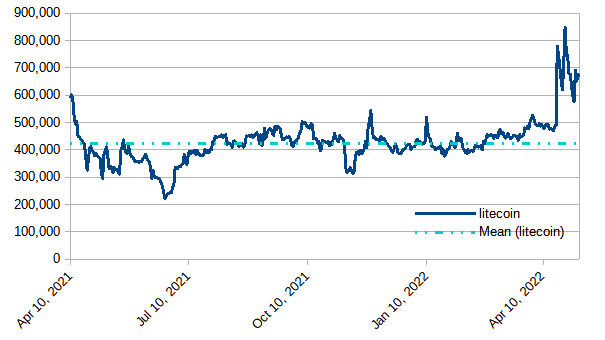
Modeled value of powered-up STEEM in terms of Litecoin
Powered-up STEEM lost ground by about 10,000 LTC, or 1 1/2%. Still running well above the historical average.
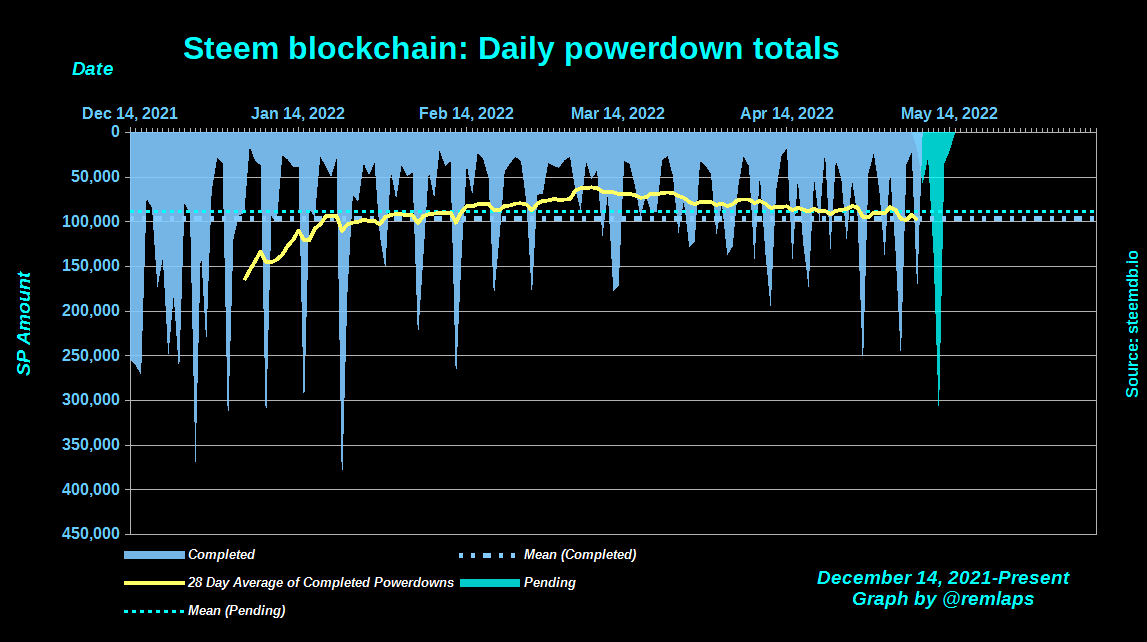
Daily Powerdown Activity
Here is graph with data from steemdb.io to show daily completed and pending powerdown activity. Overall, with about 690K powered down last week and 800K pending, we can expect weekly powerdowns to increase by about 15%. The big spike in pending powerdowns is exactly three weeks after the April 21 price pump. That spike represents more than 1/3 of this week's pending powerdowns.
The horizontal lines are the average values for completed (blue) and pending (cyan) powerdowns, and the yellow line is a 28 day moving average of completed powerdowns.
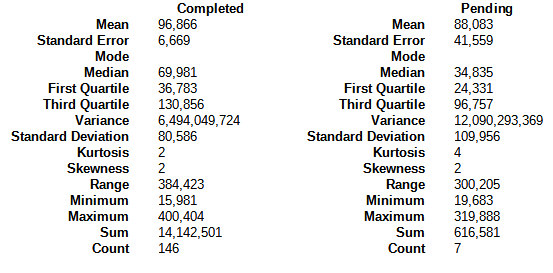
Here are some descriptive statistics for the numbers geeks:
And here are the times, dates, and amounts of the top-10 pending powerdowns:
2022-05-12T10:23:45 - 236482207773807 VESTS, 129942 STEEM
2022-05-12T10:28:48 - 135473453158428 VESTS, 74439.9 STEEM
2022-05-11T00:51:33 - 121315538772036 VESTS, 66660.4 STEEM
2022-05-12T03:17:24 - 91022194131026 VESTS, 50014.8 STEEM
2022-05-15T16:02:57 - 60370117013076 VESTS, 33172.2 STEEM
2022-05-11T11:21:09 - 32121262388259 VESTS, 17650 STEEM
2022-05-12T11:08:00 - 27672066227889 VESTS, 15205.2 STEEM
2022-05-09T03:39:36 - 27418822710312 VESTS, 15066.1 STEEM
2022-05-12T12:01:09 - 18849430329488 VESTS, 10357.4 STEEM
2022-05-15T15:34:33 - 18134861822825 VESTS, 9964.74 STEEM
Notes
- Reference prices for STEEM and other tokens are downloaded from coingecko.com
Previous posts
- Steem Total Value Powered Up - $67 million - January 2,
20212022 - Steem Total Value Powered Up - $57 million - January 9, 2022
- Steem Total Value Powered Up - $60 million - January 16, 2022
- Steem Total Value Powered Up - $43 million - January 23, 2022
- Steem Total Value Powered Up - $46 million - January 30, 2022
- Steem Total Value Powered Up - $54 million - February 6, 2022
- Steem Total Value Powered Up - $50 million - February 13, 2022
- Steem Total Value Powered Up - $46 million - February 20, 2022
- Steem Total Value Powered Up - $48 million - February 27, 2022
- Steem Total Value Powered Up - $47 million - March 6, 2022
- Steem Total Value Powered Up - $47 million - March 13, 2022
- Steem Total Value Powered Up - $51 million - March 20, 2022
- Steem Total Value Powered Up - $60 million - March 27, 2022
- Steem Total Value Powered Up - $65 million - April 3, 2022
- Steem Total Value Powered Up - $55 million - April 10, 2022
- Steem Total Value Powered Up - $68 million - April 24, 2022
- Steem Total Value Powered Up - $67 million - May 1, 2022
- Steem Total Value Powered Up - $62 million - May 8, 2022