This project started nearly two months ago with a simple goal - to determine the trends in impact of various stake-holding tiers on the Steemit community. To this effect, for the first 4 weeks, I tracked Active 24 Hours Vests distribution over time. This post - the Week 7 update - will attempt to take on a much larger scope than the previous two posts.
While the previous two updates - July and August - showed the impact of each tier was changing, they never really answered how or why. Instead, the posts raised more questions. For this post, I'll attempt to try and observe what makes the re-distribution tick. There are three major ways this happens -
- Powering Up/Down - Anecdotally, a browse through Steemwhales.com reveals that more users with high SP holding are powering down. Past #500 on the richlist, power downs become increasingly rare. 63% whales (Source: SteemDown.com) are currently powering down, leading to a net decrease in stakeholding for the whale tier. Furthermore, a glance at VESTS distribution trends for individual whales on Steemdb.com reveal a clear downward trend. The orcas are powering down at a lower rate than whales, but still much more so than dolphins and minnows. Re-distribution can be further compounded if minnows are powering up at the same time.
For a more empirical measure, @furion has a great post about user growth, distribution and power-down metrics - do check it out. Whilst @furion uses a different tiering system, the trend is clear - the Top 15 accounts are responsible for ~84% of the total Power Down while holding ~71% stake. Do note that this includes the @steemit account. Eliminating that, the Top 15 hold ~40% stake while accounting for ~62% of all power downs.
While @furion's statistics do not directly calculate power ups, the power up versus power down graph does indicate the gap between power ups and power downs is fast closing. This hints that a lot of minnows and dolphins have been powering up.
Personal speculation - Please take this with a bag full of salt. I feel a lot of Steem being traded at the exchanges are whales selling their power downs, while minnows and dolphins are buying a smaller fraction of that to power up. I believe whales who are powering down and selling Steem believe in the long term future of the platform and recognize that a less inequal Steemit would be more beneficial to them in the long term than holding a larger stake. I.e. their lower stake will be worth more.
- User Activity - Different tiers of stake-holding can have different activity patterns that change over time. E.g. If fewer whales are active, they have a lesser impact on the platform. To this effect, I have been tracking Active 24 Hours Users for each tier for the last 3 weeks. Of course, this doesn't impact "All accounts" statistics.
- Rewards - Referencing @masteryoda's great monthly recap for payouts in August, SBD 1.2 million + 3.6 billion VESTS (1.1 million SP) were paid out. This is roughly a quarter the amount being re-distributed through powering up and down, but still significant.
A vast majority of the top earners for August are minnows and dolphins, with very few orcas or whales making the list. (Of course, there are always exceptions.)Speculation - Whales are likely to earn greater curation rewards voting on new authors where few people are voting, rather than higher staked established authors, who are followed by significant vote swarms. Beyond that, once again, whales probably realize that a more equal Steemit is essential for growth.
- Movement between tiers - Users are promoted into upper tiers or (much less often) demoted down into lower ones constantly. Usually this is a well balanced phenomenon - for every user that moves up, there are many more that up from a bottom tier - but sometimes movement up and out of a tier may be more rapid than movement into it. While this does have a small impact, it's not as significant as the other three factors.
I hope that addresses a bit about how re-distribution is happening. Of course, save for some limited speculation above, this only raises more questions about why, but that would be an interesting discussion down below!
With the hows and whys out of the way, let's get down to the metrics updated to Week 7. All Vests distribution charts cover Jul 14th to Sep 3rd, while User Activity is since 15th August.
Oh, and yes, we will finally have a look through the All Accounts metric as well! But first up is Daily Active Users.
Part 1 - Daily Active Users
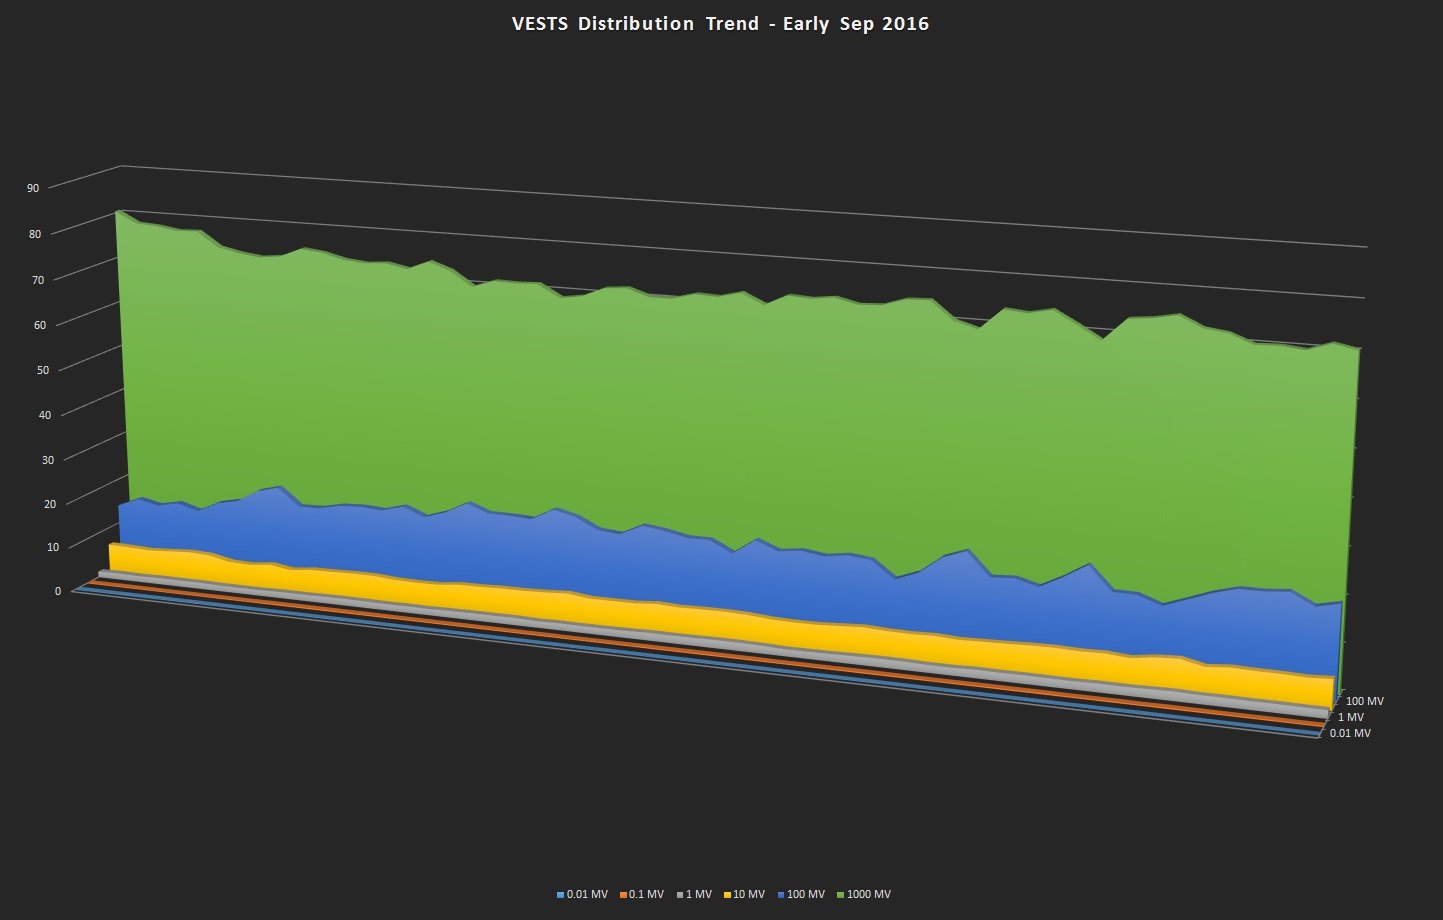
We shall begin with the obligatory hero stacked chart, of course!
Orcas (100M to 1B Vests)
Right off the bat, things are different this time - we shall begin with the Orcas. In the August Update, we found a sharp decline in stake-holding for the Orcas. This continued for a while, but then lead to a sharp increase around Week 5. Followed immediately by a sharp decline, and so on. It was just very erratic and didn't really make sense. What really happened was that the Orcas activity patterns have been rather mercurial.
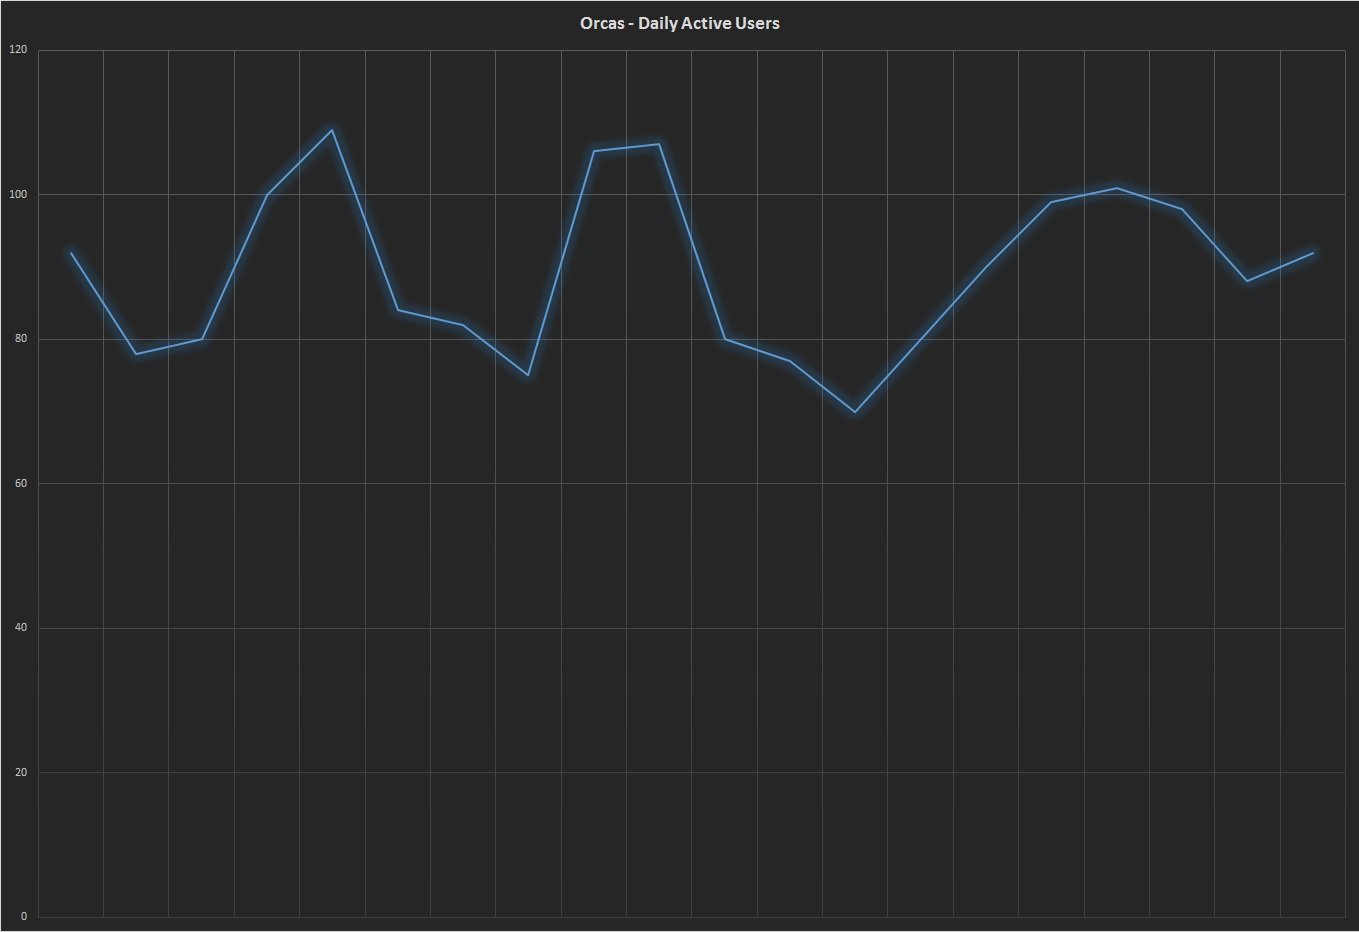
No, there's no real pattern here either - it's not as if they are more active during weekdays or weekends. Orcas were just very unpredictable from Weeks 4 to 6. The relative standard deviation in daily active users for every other tier is around 5%. For Orcas it's over 13%! So they are nearly 3x as erratic with their activity habits. However, by Week 7, activity has started stabilizing around the 90-100 active users daily.
This translates directly to our SP Distribution chart, of course, the impact of Orcas on the community varies day by day.
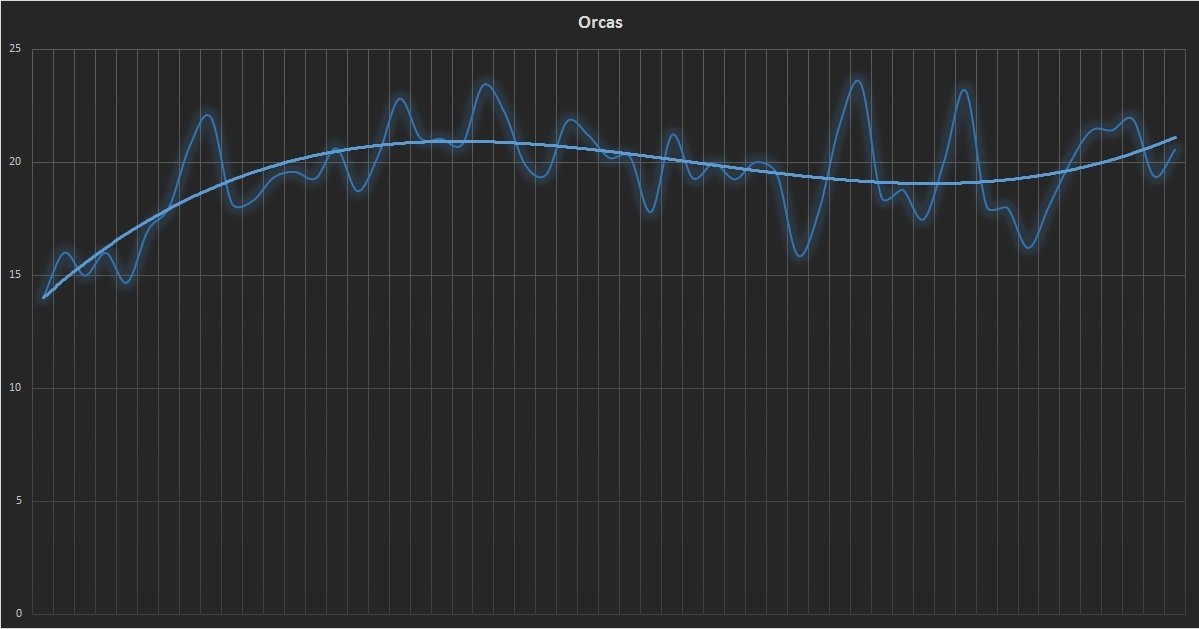
Thanks to greater consistency in Week 7, the Orcas' stake-holding is recovering, though still short of the peaks seen in late July.
Whales (1B+ Vests)
In comparison, whales have been much more consistent with their activity. It is clear to see however, that their stake-holding on a daily basis is impacted inversely by the activity of Orcas. Looking at the stacked chart - it's clear to see.
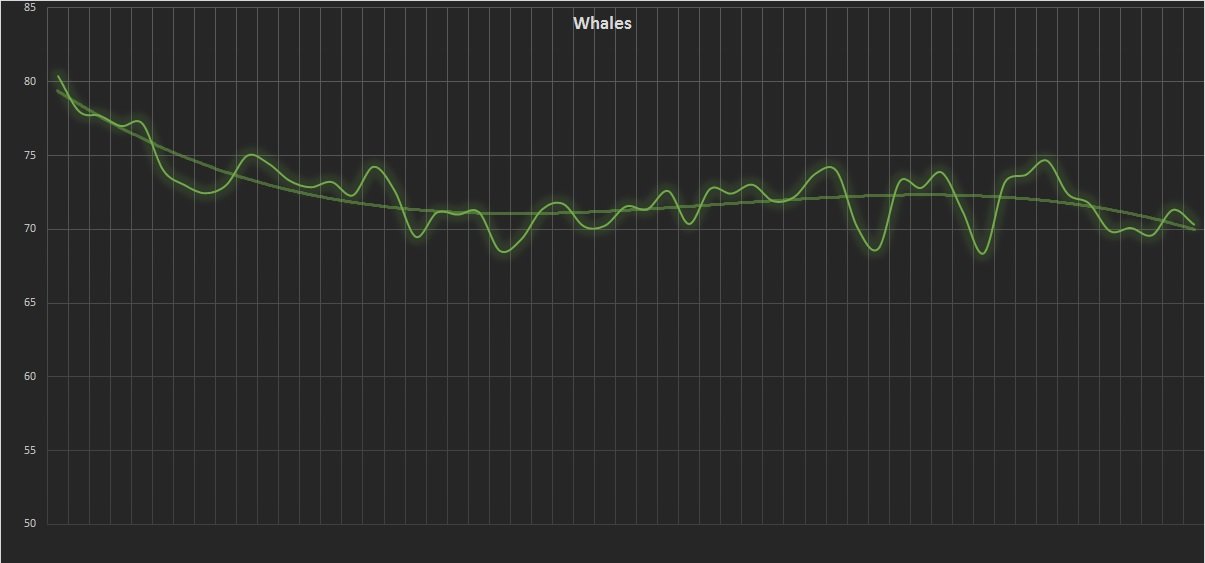
The temporary uptick we saw in August has been reversed, and with renewed consistency from the Orcas, the Whales' stake-holding has started declining sharply once again - as the trendline suggests.
Dolphins (10M to 100M Vests)
Curiously, the Dolphins' stake-holding trend has pretty much flattened out.
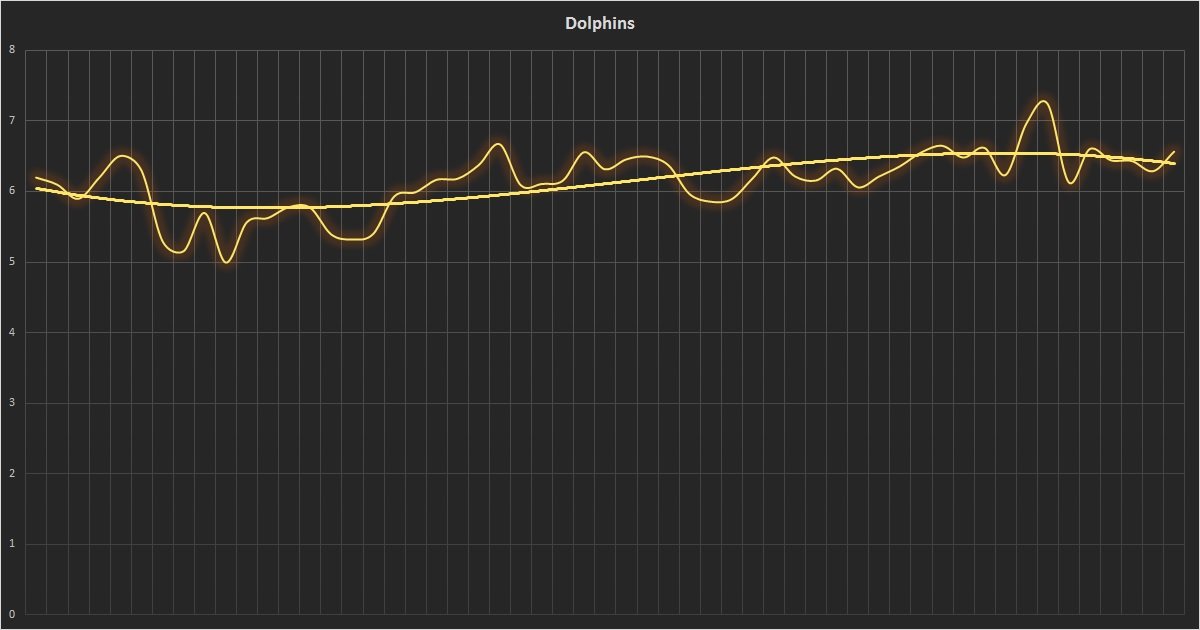
This is the only tier where the fourth cause - movement between tiers - has an effect. As per the Steemd Richlist, there's a disproportionately large number of Dolphins who have moved up to the Orca tier in Weeks 6 and 7. This effect should stabilize, as many more line up to move from the Minnows tiers to Dolphin.
Minnows (Under 10M Vests)
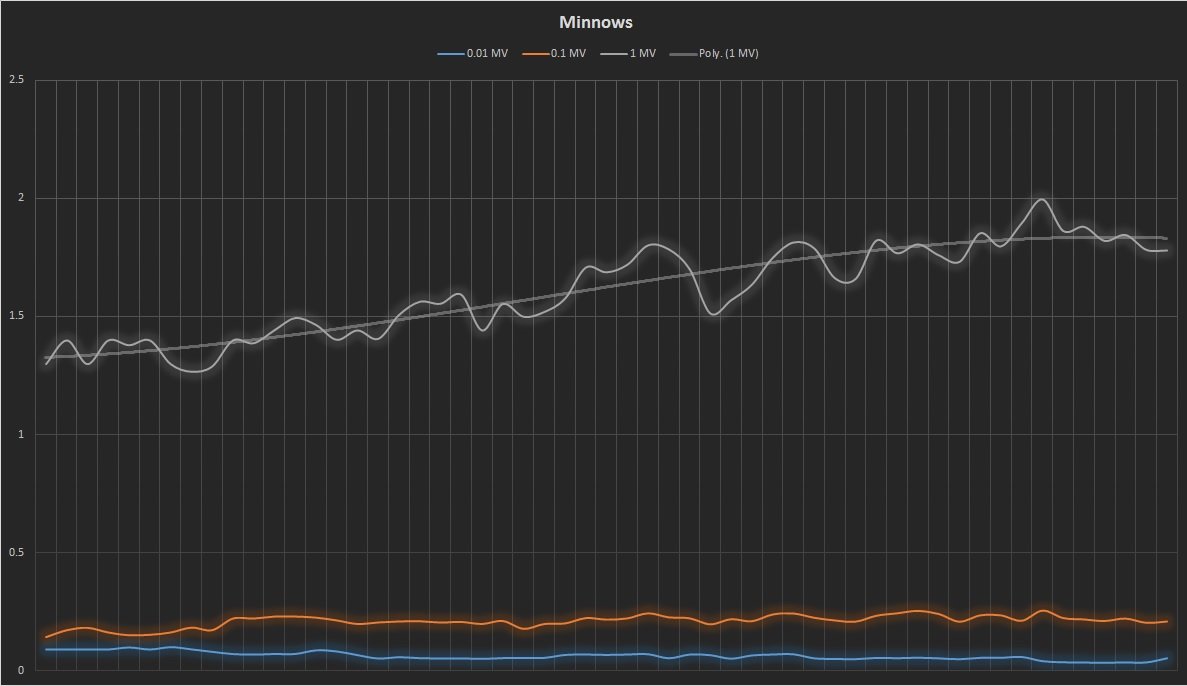
The minnows continue their march upwards. By the end of Week 6, we saw a new peak of nearly 2% for the 1MV to 10 MV tier. Week 7 saw a slight flattening out.
As always, users don't last in the 0.1 MV to 1 MV - those who get past the initial hurdle quickly move on past 1 MV. This is one tier I expect to be pretty flat throughout.
The last tier - 0.01 MV to 0.1 MV - has taken a major blow. This is why -
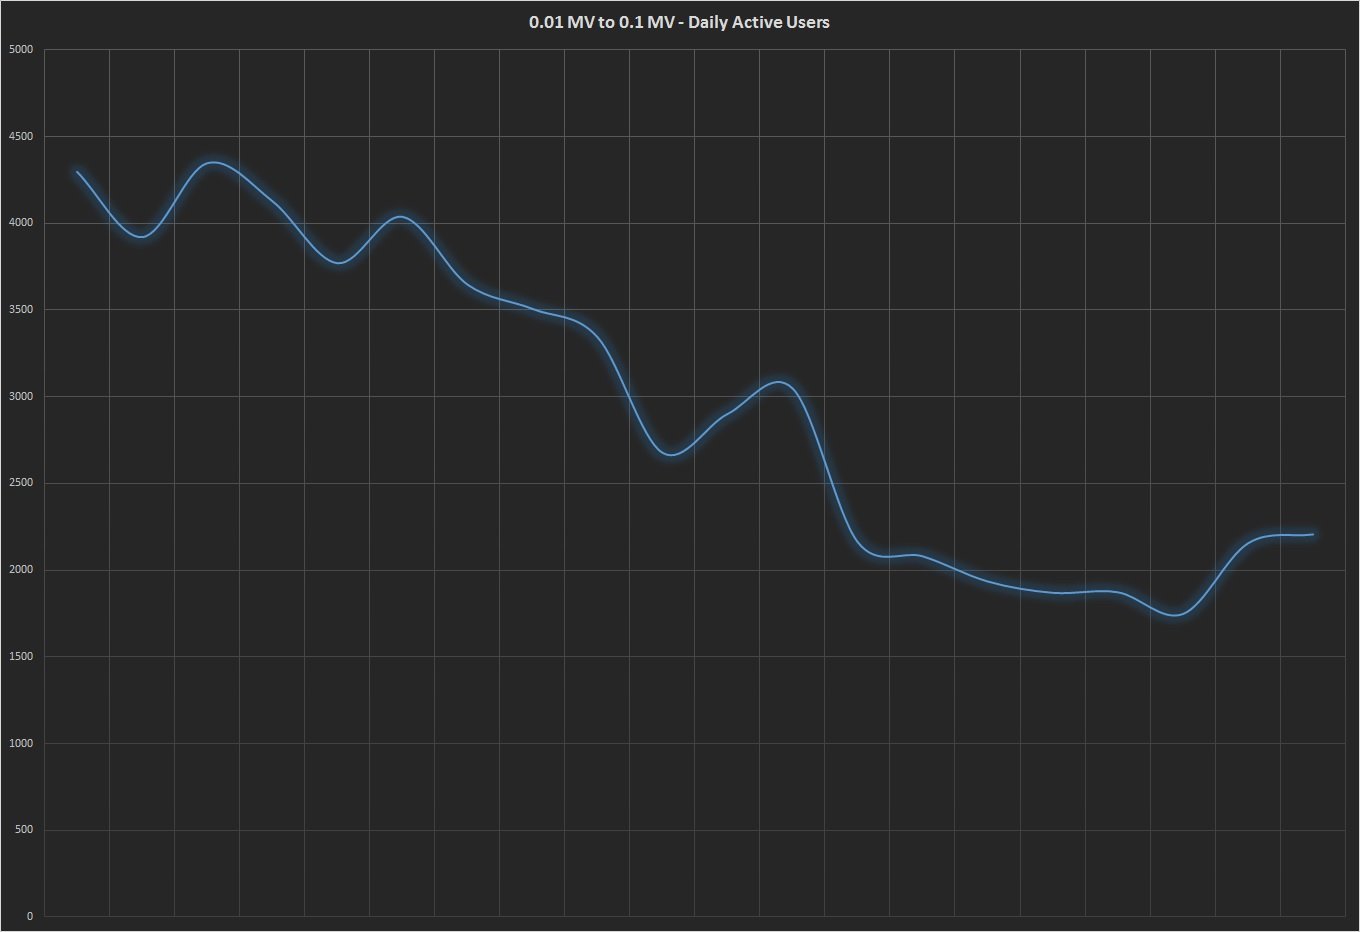
Daily active users for this tier has simply nosedived. Of course, this is the intended effect of measures employed to counteract spam.
As an aside, the activity for other tiers has not been affected. I had initially planned to dive into details of activity, but that would have made this post far more bloated than it already is. I'll be happy to create a separate article focusing on activity trends if there's demand for it.
Part 2 - All Accounts
This is the one I receive most requests for - distribution trends for all users. Needless to say, this metric includes inactive accounts, bots, investors, and others who don't directly impact the Steemit community. However, they do have a stake in the Steem ecosystem, and that is what this section is for. It also ignores activity levels, so it'll give a clearer picture of just SP re-distribution. Finally, since a vast majority of accounts have a negligible stake-holding, they should not impact the numbers too much.
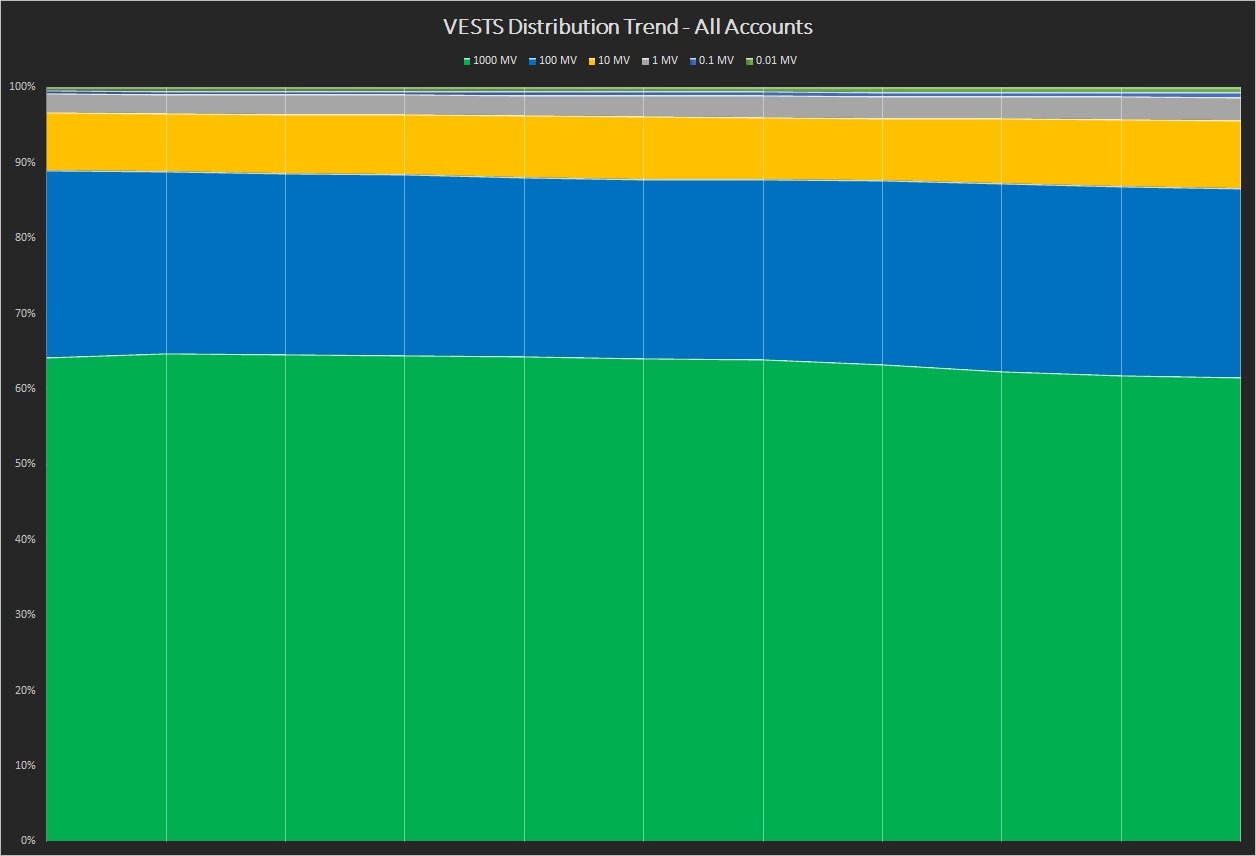
The movements are slow, but sure, with the All Accounts metric.
Whales
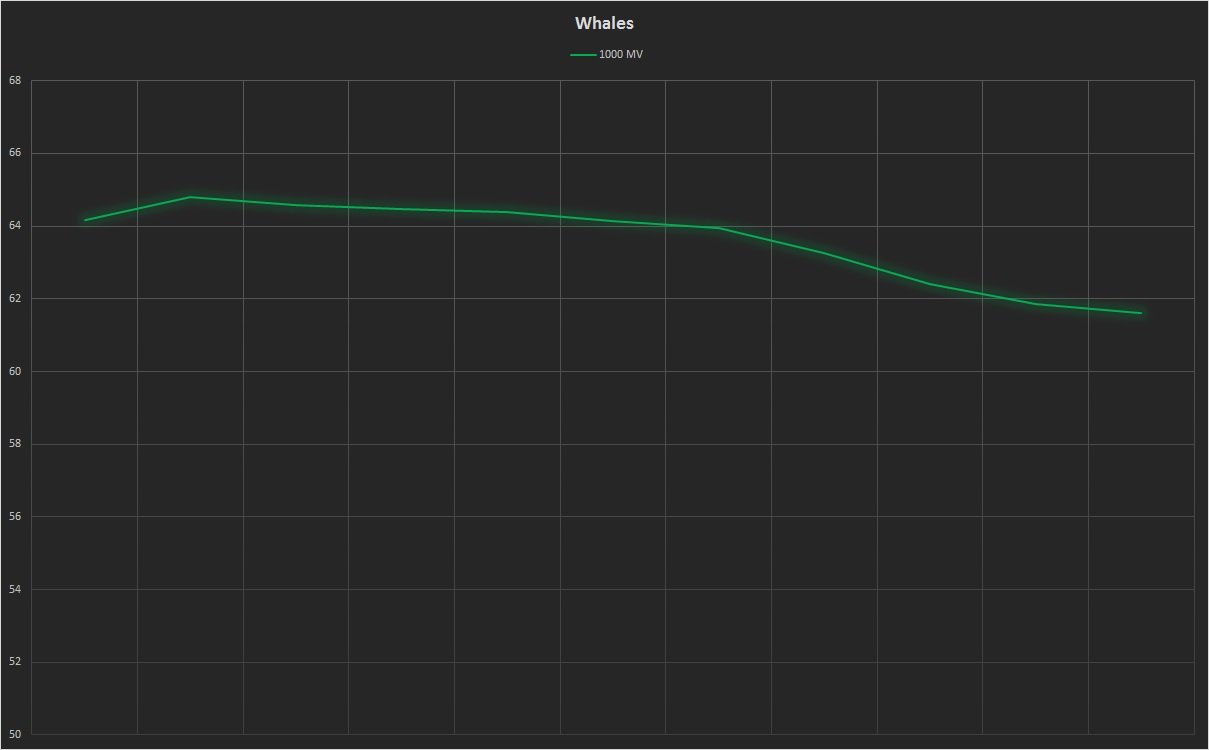
The Whales' overall stake-holding has continued to decline, as expected. It's been slow, but steady. Curiously, the drop has accelerated over Weeks 4 to 7, while on the Daily Active Users metric the decline was dramatic in Weeks 1 to 3. This might be due to the increase in activity of Whales we saw in early August, which masked the fact that overall re-distribution was actually accelerating.
Orcas and Dolphins
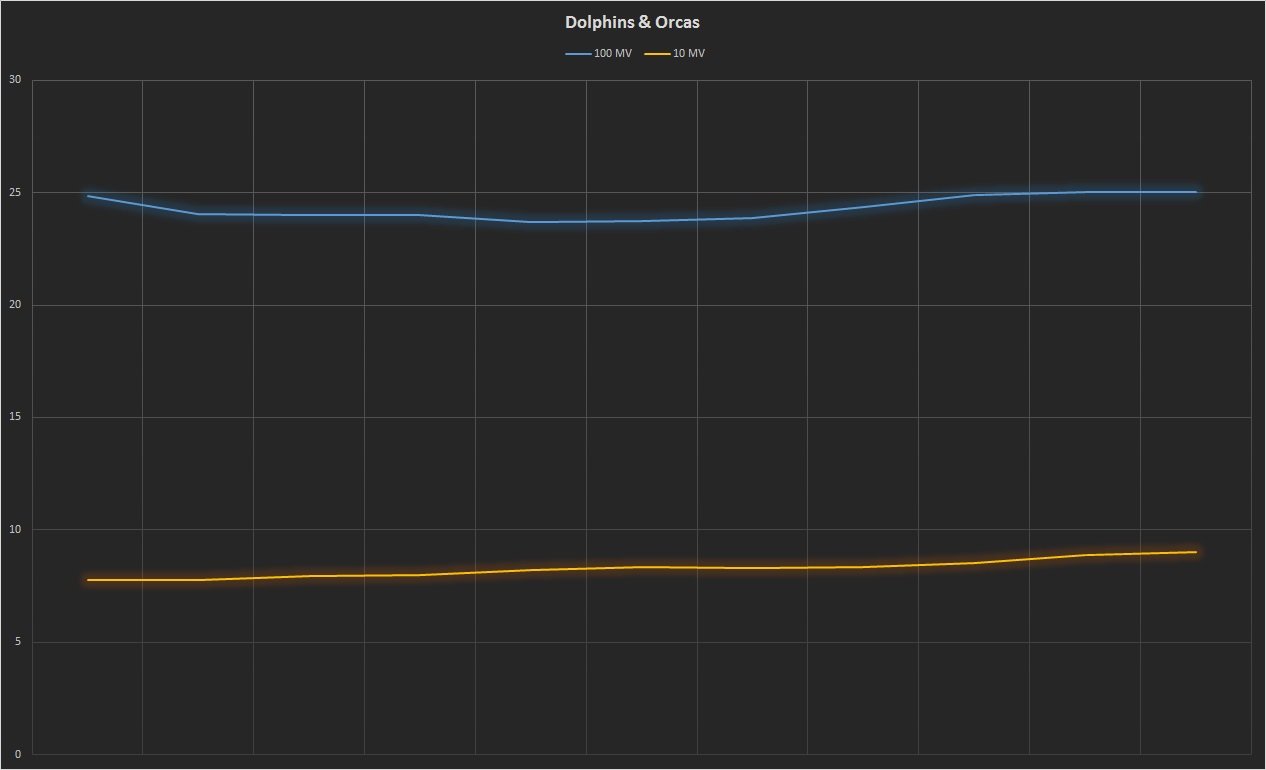
Orcas have effectively maintained their stake-holding. There was a decline in Week 1, but the stake-holding lost was recovered in Week 5/6. Since then, Orcas stake-holding has pretty much been flat.
The Dolphins have continued to gain steadily. Over the 7 weeks, they have increased from 7.75% to 9% - a 15% jump. At this rate, within 6-12 months we should have a solid "middle class".
Minnows
The minnows tiers should be taken with a grain of salt as this is where a vast majority of bots and bogus accounts reside.
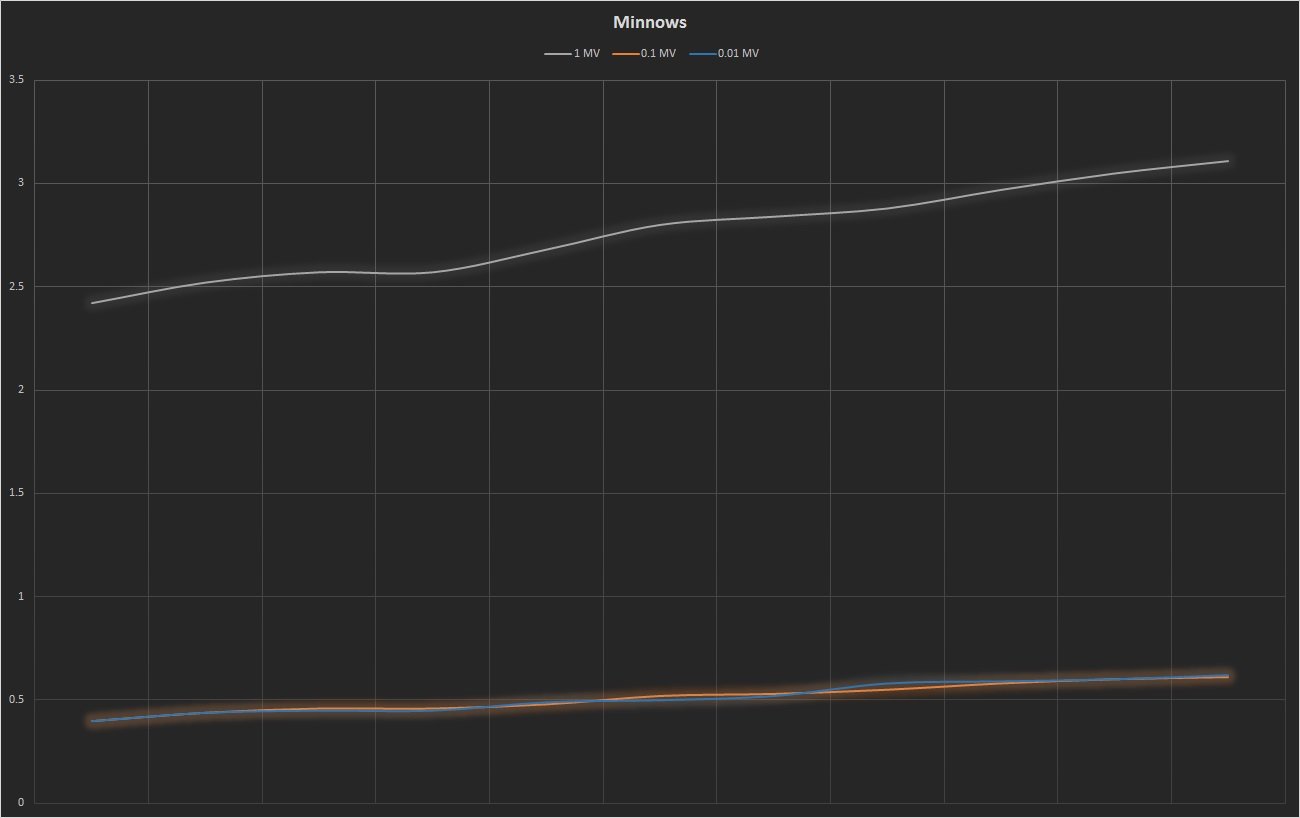
Moving further down, the rise of the minnows is even more significant. The crucial 1MV to 10MV tier sees an incredible ~30% uplift in 7 short weeks. And accelerating!
For the final two tiers, this jump is 50%! Of course, coming from 0.4%, you'll only ever go so far, but these are tell-tale signs of effective re-distribution.
The 0.1 MV tier has effectively merged with the 0.01 MV due to sheer quantity. There are 72,000 krills occupying the 0.01 MV to 0.1 MV tier. Still, at 0.6% stake-holding, it should not significantly affect the upper tiers.
TL;DR
It's always important to remember that Steemit is still in beta, and Steem is still in distribution phase. It's going to be a wild ride full of weirdness and excitement, but the overall picture is clear - Steemit is getting more equal all the time.
