Investors will often look at the price of STEEM to see whether STEEM/SP is a good investment. While the price of STEEM is an important factor, it only tells part of the story. Prior to HF-16, Steem Power holders were gaining massive amounts of new STEEM, due to the inflation.
As I wrote about in this post, it was possible for the value of SP to go up, even while the price of STEEM went down! The price of 1 MV or MVEST (the unit of measurement of Steem Power) is a much better indicator of how an investment of SP has done over time.
Back when the price of STEEM was crashing from it's July peak, people were panicking because there seemed to be no bottom for the price of STEEM. The technical analysis that was being done though was not factoring in the inflation.
I looked for a way to demonstrate this, but there were no sites that contained historical SP or MVEST prices. Steemd.com showed the current MV price, but unless you had been collecting the data all along - there was no way to go back and see how it had done over time.
I knew that this data would be valuable for investors, so I decided to gather the data and calculate it myself :)
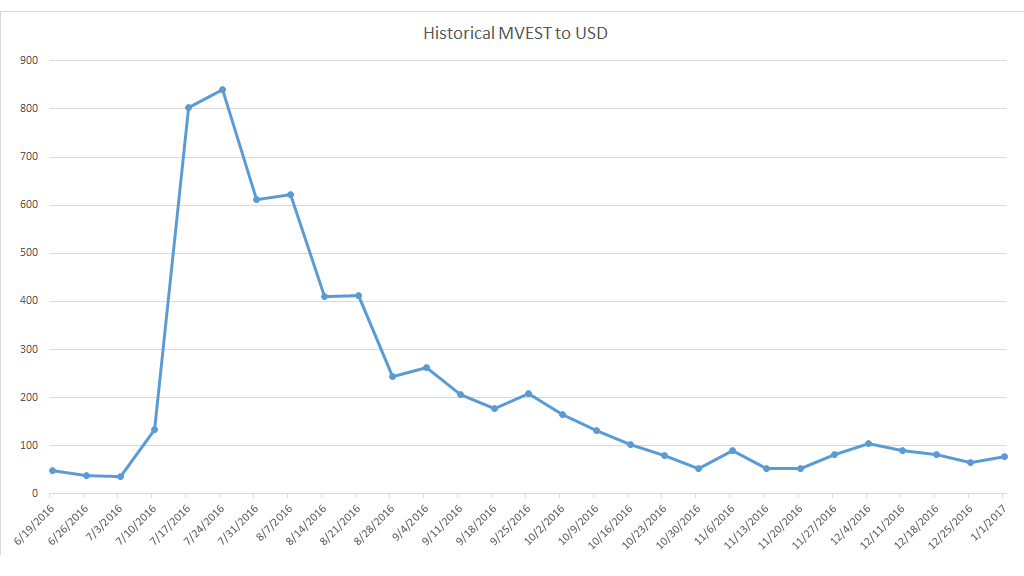
This post shows the MV/USD prices from 6/19/2016 through 1/1/2017.
Disclaimer:
All of this data was collected by me and calculated by hand. I worked hard to ensure its accuracy, but I cannot guarantee the numbers are 100% correct. The numbers were taken in 7 day increments. Also, there is going to be some slight skewing of the numbers because the data-points were collected from different sites, and they may not have published their data at exactly the same times of the day. (Example the price of STEEM may have been from 7:30, but the price of BTC might have been from 9:15.) Other users are encouraged to follow the steps that I did to ensure the accuracy of the data and calculations. The use of alternate data sources to cross-check the numbers is encouraged as well!
Here is the chart showing the historical MVEST to USD price over time:

Here is how I did the calculations:
- I used the weekly power downs from the @steemit account (shown on @steemd.com) to determine how much STEEM was withdrawn per the amount of "vests" that were powered down from the account. This is the STEEM/MV ratio.
- I looked up the BTC price of STEEM for each of those days from http://coinmarketcap.com, to get the "STEEM to BTC" price.
- I looked up the BTC to USD price for each of those days from http://www.coindesk.com/price/, to get the "BTC to USD" price.
- I combined the "STEEM to BTC" and "BTC to USD" prices to get the "STEEM to USD" price.
- I used the STEEM/MV ratio and the "STEEM to USD" price to calculate the "MV to USD" price.
Here is the raw data:

Another interesting chart is the historic STEEM per MVEST data:

Please remember to read the disclaimer above regarding the accuracy of the data.
Reminder to vote for the witnesses that you think are doing a great job:
https://steemit.com/~witnesses
If you aren't sure who to vote for, check out this Witness Voting Guide!
