I did a forecasting of the Steem Dollar Volume, to see what it will be in the future, and the results were shocking.
I have selected the trade volume measured in BTC of the Steem Dollar, because this is the most interesting parameter. I could have measured the price in BTC or the volume in SBD itself, but those are not interesting. The price of SBD is pegged to BTC which is pegged to 1$, so there are 2 loose variables, which are hard to factor in, when forecasting.
So I think the Volume of the SBD is more interesting, since in my theory if the SBD is traded well, it is more liquid, and the 1$ peg is easier to maintain. If the SBD is not liquid, then the buy wall will have thin depth and it could go down if a big whale were to sell his SBD. So it order to have a liquid market, with thin spread and favorable prices, we need to have big trade volume. And this is what I have forecasted.
Forecasting wih ARIMA(p,d,q)
I have already played around with quantitative analysis (quant) tools in my past articles:
@profitgenerator/let-s-calculate-the-probability-of-bitcoin-going-to-1000usd-and-above-pt-2
@profitgenerator/let-s-calculate-the-probability-of-bitcoin-going-to-1000usd-and-above-pt-2
And I have begun to love them again, so you will see many more scientific forecast articles from me. In this research, I have used ARIMA, to forecast the volume.
I have grabbed the volume of the BTC_SBD market with the Poloniex API, in 5 the minute periods. This is how the volume chart looks like since it's inception Tue Jul 19 04:30:00 2016 UTC up to yesterday:
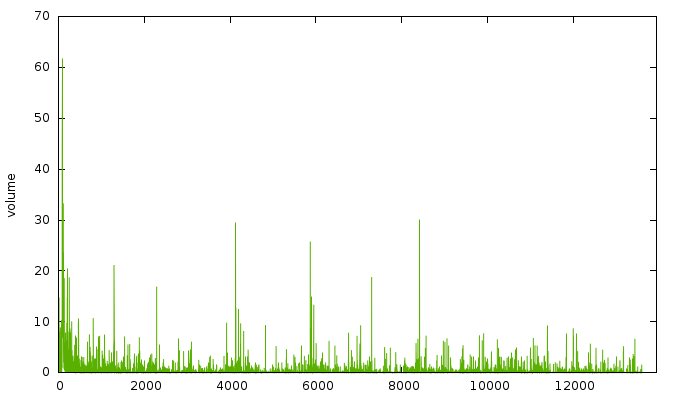
The API can be called with:
https://poloniex.com/public?command=returnChartData¤cyPair=BTC_SBD&start=1&end=9999999999&period=300
But it gives it in .JSON format, so it has to be converted into .CSV before we can use it. We did that, so we started analyzing the data.
First thing is first, we need to establish if there is a trend or not. From the chart itself by looking at it, it's obvious that there is no trend and that the dataset is stationary. But that is subjective so we need to objectively measure it.
We use an Augmented Dickey-Fuller test and a Kwiatkowski–Phillips–Schmidt–Shin test, and both have suggested that the data is stationary.
This means that we don't need to differentiate the data and the d = 0, which means that we will have an ARMA(p,q) model, or ARIMA(p,0,q) essentially.
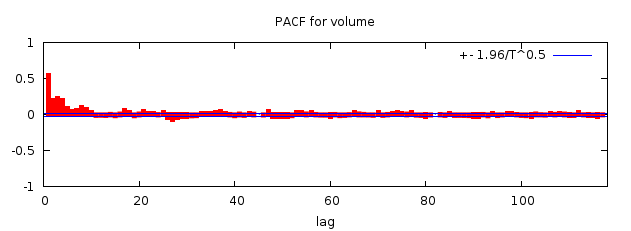
Then we estimate the p and q values with the Partial autocorrelation function , and see that the optimal parameters range from 1-10.
Then I had to go through all combinations, but stopped the calculation at some time, since it took an awfully lot time time to compute certain values. Remember quant analysis at Wallstreet is done by supercomputers, that go through all possible coefficient permutations. I don't have that kind of resources, so my calculations are limited in accuracy.
I have stopped at ARMA(2,10), which is still a pretty decent model for this dataset. Here are the coefficients if you want to calculate it, with their standard error estimation.
| variable | coefficient | standard error |
|---|---|---|
| constant | 0.343512 | 0.0908014 |
| phi_1 | 1.59072 | 0.0491846 |
| phi_2 | −0.597998 | 0.0476801 |
| theta_1 | −1.28657 | 0.0494523 |
| theta_2 | 0.252297 | 0.0357579 |
| theta_3 | 0.129604 | 0.0158901 |
| theta_4 | 0.0533278 | 0.0140486 |
| theta_5 | −0.0914508 | 0.0150106 |
| theta_6 | −0.0190010 | 0.0137436 |
| theta_7 | 0.0256495 | 0.0134067 |
| theta_8 | 0.0659363 | 0.0159579 |
| theta_9 | −0.0166028 | 0.0168858 |
| theta_10 | −0.0500762 | 0.0101774 |
We see that the that this is a decent model, with very low Mean Absolute Error of 0.39361, much lower than our BTC price forecast:
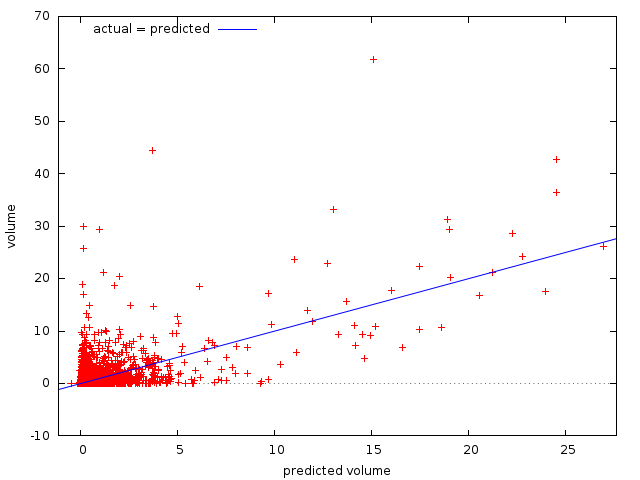
I have also observed that the volume is often 0 BTC, now I don't know if this is an error of Poloniex or that if the volume was that low at certain points, but it's worth noting. Yet, despite this our model still gives us a very low error margin.
I have also observed many indications that GARCH model could be used too. Unfortunately I cannot find my GARCH scripts, so I could not do that test, but given our low error margins, I think ARMA(2,10) is pretty decent.
This is our forecast for the next 5500 periods which would translate to 19 days, where there is a 99% chance that the volume will be in the green box:
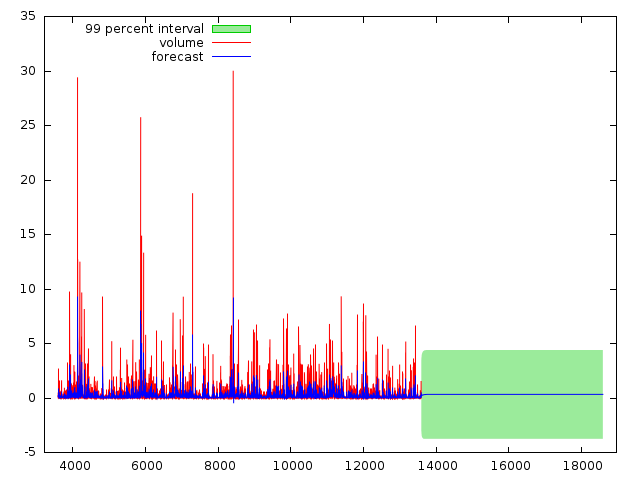
And since we know the volume can't go negative, it will be probably between 0 and 4.9 BTC. Nothing surprising, but I just thought it's worth analyzing it and see how much effect do those big spikes have on the average volume.
It turns out not much, so the big spikes are just random anomalies and the average volume will probably have the boundaries mentioned above.
That's it for this analysis, I hope I can find my additional tools in the future and perform more deep analysis. In my next article I will forecast the STEEM price itself. It will be exciting, stay tuned!
Disclaimer: The information provided on this page might be incorrect. I am not responsible if you lose money from the information you've read on this page! This is not an investment advice, just my opinion and analysis.