Hey everyone!
How are things? I sincerely hope everyone of you had a great time during the week. It has been a rather exhausting week so I'm currently looking forward to a relaxing weekend. Today is a brand new day which means another opportunity for a fresh start, so here I am with another Cartography blog. No time to play around though, so let's get this started!
As promised in my previous introductory posts about Cartography, this is the third part of the trilogy regarding the science of creating accurate 2D depictions of our 3D world and extracting geographic information. Today I'm taking the chance to share some introductory technical information concerning the proper selection of cartographic projections. We will also discuss the utilization of various cartographic transformations, so bare with me!
Once again I'd like to mention that these are still introductory posts. This basically means we will be discussing general information in a fun way in order to keep things simple. However, there's a high chance of learning a thing or two by reading this post, so stay focused!
Image Source: pixabay.com
Objective
Cartographers need to possess advanced knowledge regarding the various kinds of cartographic projections that have been developed and are used nowadays. The potential effect of any given transformation on the measurement and precise depiction of angles, distances and directions can be predicted and therefore Cartographers are in a position to determine the analyses that can be applied and the information which can be extracted from a map. Furthermore, Cartographers need to possess advanced knowledge regarding the characteristics of distortion of the cartographic projections utilized, as it is frequently demanded to transmit data from one projection to another and thus the preservation of the accuracy included in the initial map is necessary. It is apparent that Cartographers have to choose a projection wisely when building a map; it is all about determining which projection's characteristics serve the map's purpose most efficiently.
There are many different factors that have to be taken into consideration when selecting a projection, mainly due to the fact that different scientific or professional fields demand different sorts of information from a map. For instance, Geographers are mainly interested in accuracy regarding the shape of geographic entities, whereas Astronauts and Engineers are more interested in precise information concerning angles and distances. However, due to the fact that all cartographic projections induce various kinds of distortion, mappings are frequently considered as inferior quality substitutes of the globe. However, projections provide significant technical advantages by allowing the depiction of distributions and the efficient transmission of information. Obviously, there can be no comparison between different projections as all projections were designed to serve different purposes in Cartography. There are no better projections; only better decisions and choices.
Image Source: pixabay.com
There are multiple factors that have to be taken into consideration when picking a cartographic transformation for the design and development of a map's projection. Basic attributes of the projection utilized, such as equivalence or compliance, along with main characteristics, such as flat coordinates and spatial distortion, are precisely calculated and play an important role regarding the map's efficiency of transmitting information. It's worth noting at this point that there are two main types of distortion in Cartography: surface (S) and angular (Ω) distortion. The average distortion of a projection is the maximum angular or surface distortion and is calculated as the average value of distortion in various areas of the projection. Let's always keep in mind that different projections demonstrate different distortion provisions and therefore demand a different approach regarding the extraction of information.
The precise depiction of geographic entities' shapes is absolutely necessary in Cartography and the shape and size of the paper used in printing mappings is default. Therefore Cartographers are able to increase the map scale significantly by utilizing the most suitable projection regarding the map's purpose. This can prove to be a rather significant advantage in cases of detailed mappings that include large amounts of information. Furthermore, the utilization of computers for the design and development of cartographic projections is possible by defining the mathematical equations and statistical criteria that describe the cartographic transformation applied. This process enables Cartographers to minimize the distortion induced by the projection concerning given areas of the map. It is worth keeping in mind that all cartographic projections are unique and designed for specific purposes. Cartography has a bright future ahead, given the possibilities provided by technology nowadays.
Image Source: pixabay.com
Cartographic Transformations - Broad Categories
It is practically impossible to include and demonstrate all correlations between phenomena and geographic entities depicted whenever the projection of the Earth's spherical surface on a 2D surface is attempted. As a result, various sorts of differences between the globe and maps are observed and measured regarding the depicted geographic entities' geometric attributes and correlations in particular. Significant variations of angular quantities and alterations of the magnitude of distances and shapes are measured and described as distortion. Let's always keep in mind that there are four main types of cartographic transformations utilized in the design and development of cartographic projections. Let's take a deeper look and discuss a few words about each and everyone of those four main types of cartographic transformations.
Transformation of Angles
As explained in a previous post, prevailing wind directions on any given point of the Earth's surface (apart from the poles) have a phase difference of 90 degrees. This specific attribute of angular correlations can easily be preserved and demonstrated on cartographic projections that are also known as compliant projections, mainly due to the precise depiction of the angles of geographic entities. Let's keep in mind that the precise depiction of the shape of a geographic entity is only possible for small areas of the Earth's surface and therefore we're only talking about large scale maps, as mentioned in another previous post as well. Concerning the reference sphere, which is a reference system designed according to the planet's actual dimensions, the scale factor obviously equals 1 in all directions and surface points. However all transformations induce distortion regarding distances, shapes or angles and inevitably the precise variation of the scale factor between different areas is essential.
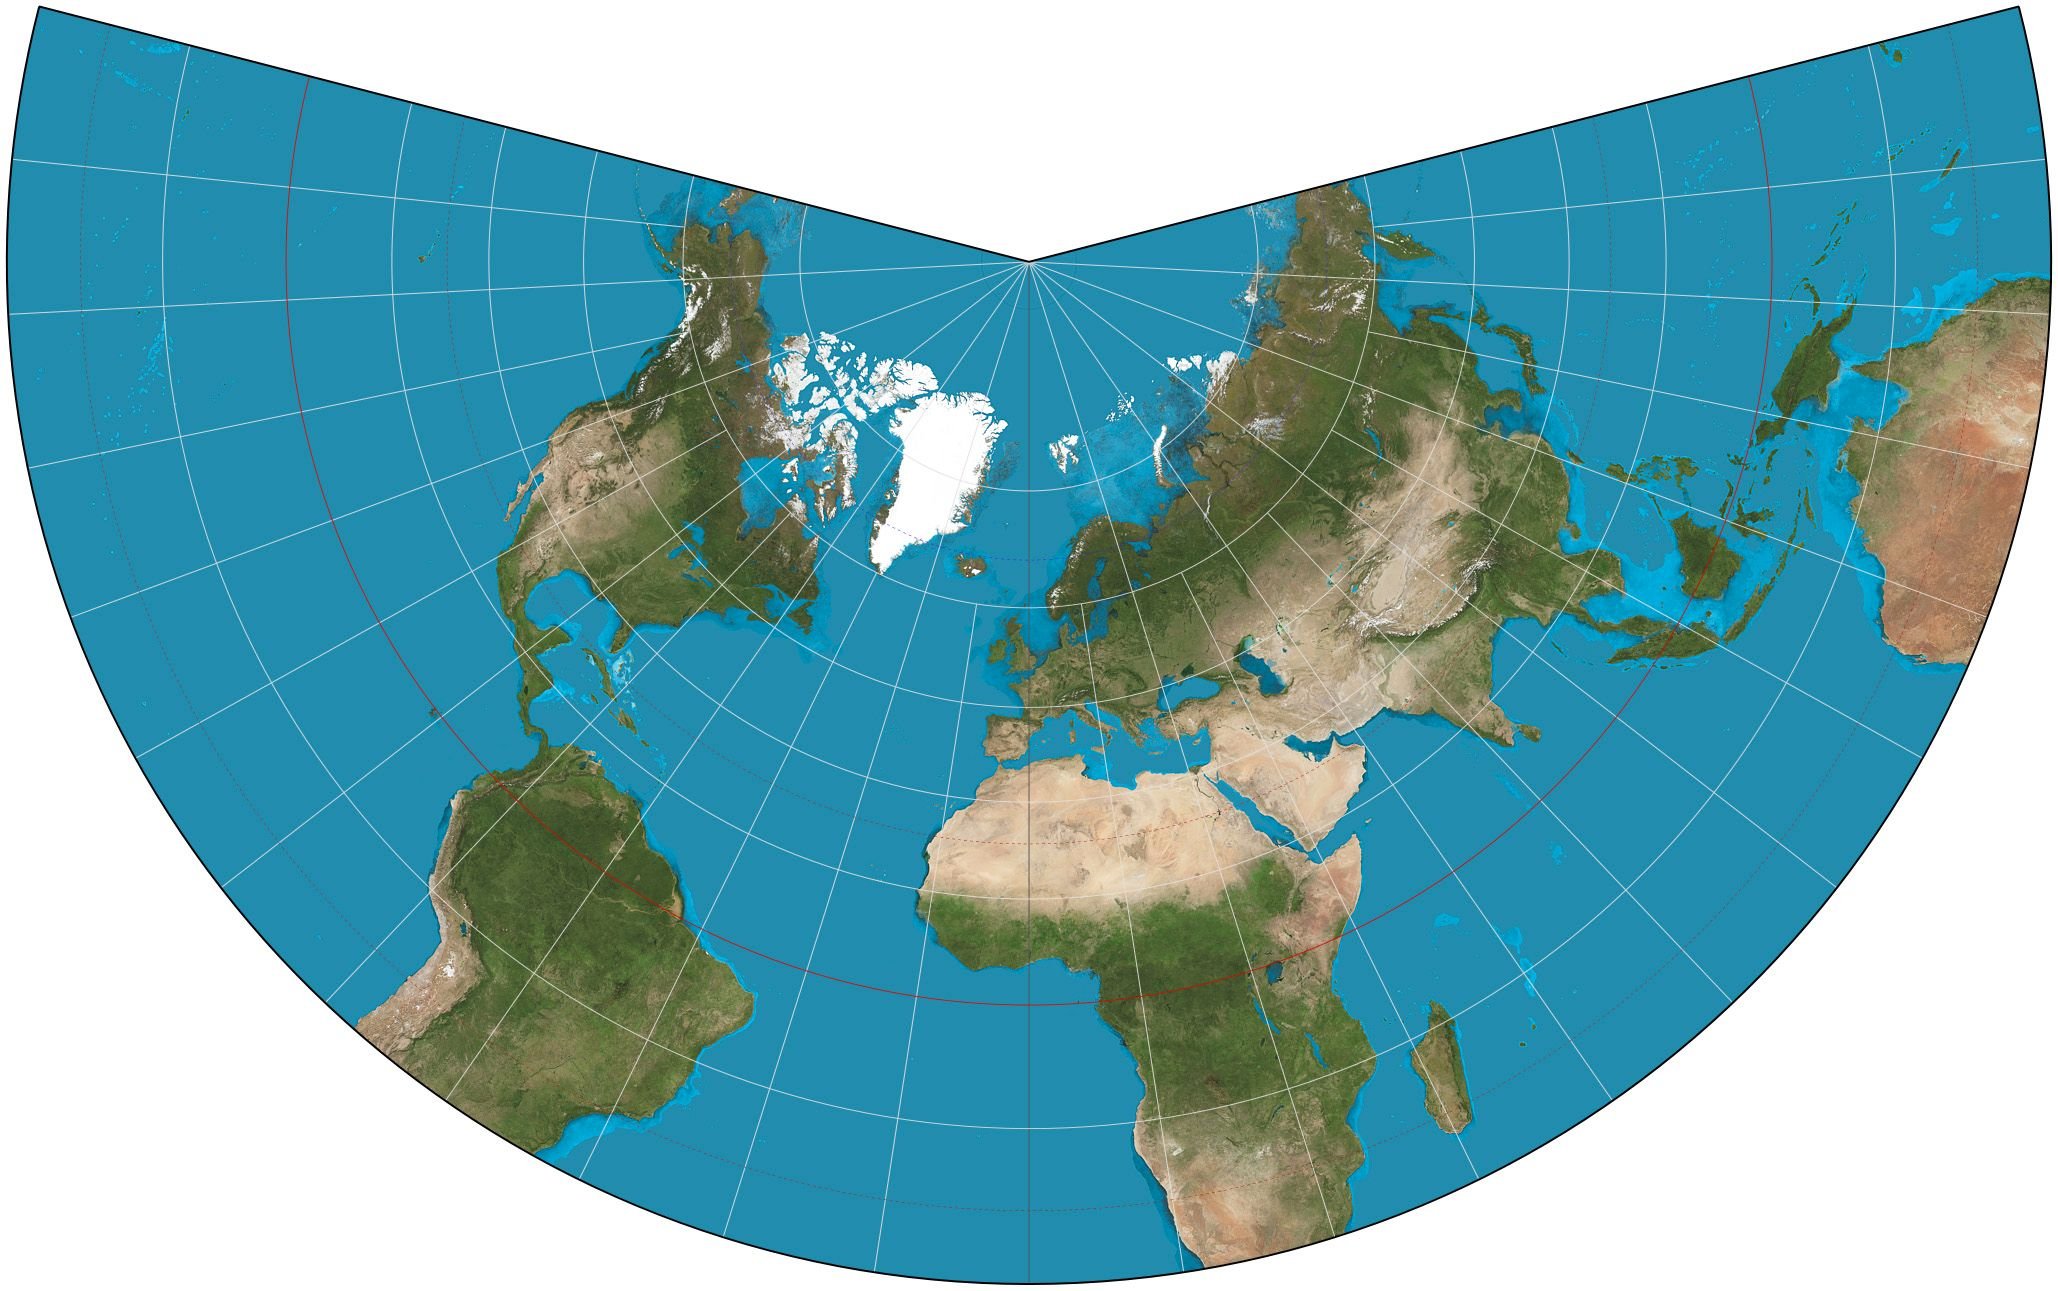
Cartographers can achieve the same scale factor values for all directions regarding specific points on the surface of a projection by utilizing stretching and compression techniques and therefore creating a compromise projection (a = b). It's worth noting at this point that in this case the scale factor's value does not equal 1 for all points on the projection's surface. As a result all directions are depicted precisely and therefore Meridians intersect Parallels absolutely vertically. Let's always keep in mind that this desired outcome is not always accomplished regarding distances of remote points on the projection's surface . It is also worth keeping in mind that the depiction of vertical intersections between Meridians and Parallels is a main characteristic of compromise projections, however there are various non-compromise projections that demonstate this specific sort of geographic correlation between Meridians and Parallels as well.
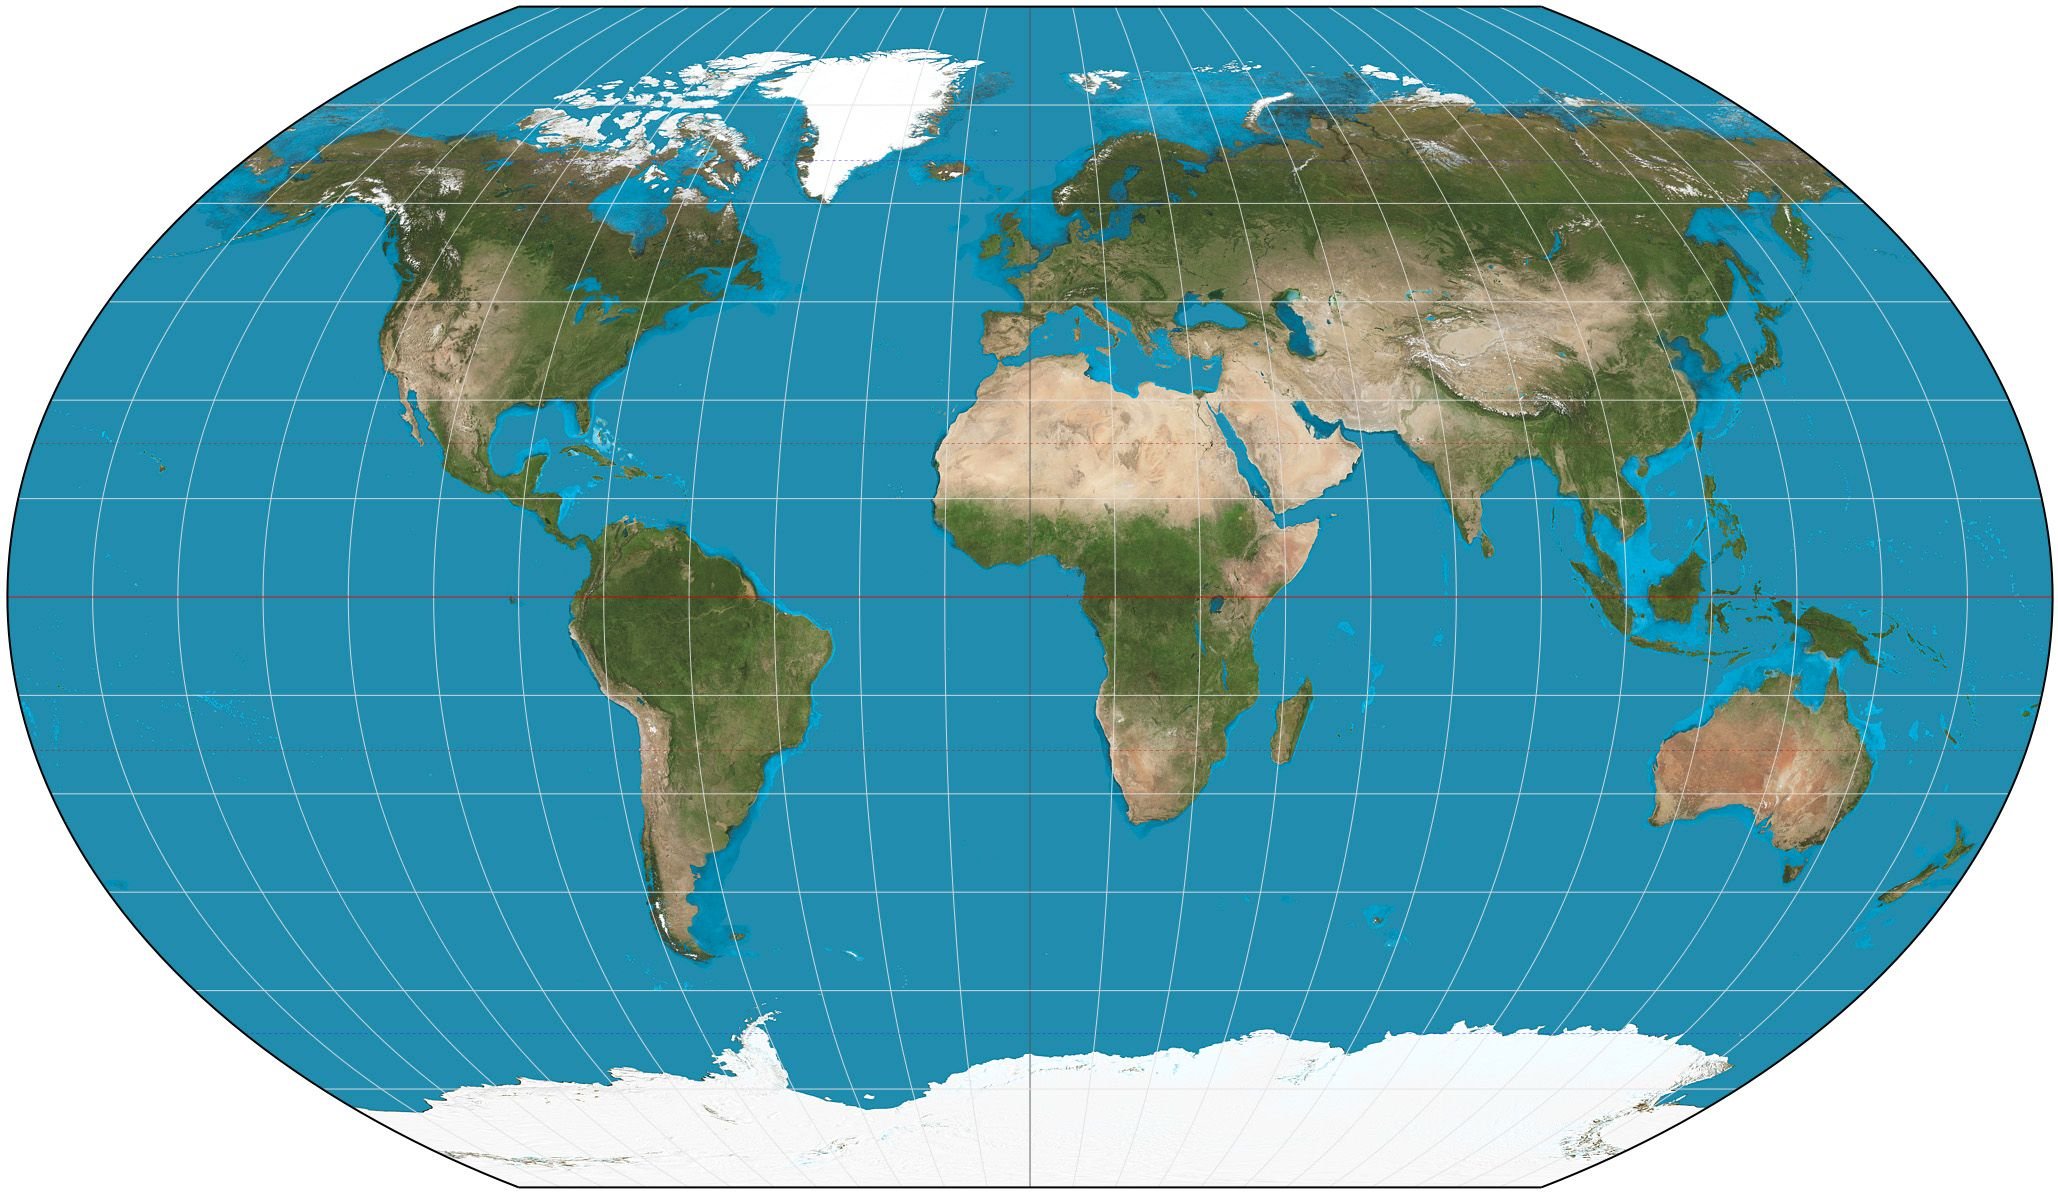
Kavraiskiy VII Projection SW/ Image Source: en.wikipedia.org
Transformation of Surfaces
Cartographers are capable of preserving the desired accuracy regarding shape when depicting large areas of the Earth's surface in a way that the sizes and dimensions of different geographic entities are relatively precise. This is achieved through the design and utilization of cartographic projections that are also known as equal-area projections and demonstrate rather useful attributes which are engineered by adjusting the scale factor accordingly in primary directions. As a result, the product of scale factors equals 1 ( a*b = 1 ) for any given point on the projection's surface. However let's always keep in mind that the scale factor in primary directions differs slightly in relation to every other direction regarding given points. In other words, equal-area projections are not conformal and this fact must be taken into consideration when extracting geographic information equal-area projections.
It is obvious by now that the technical requirements concerning the map scale between equal-area and compromise projections are totally different. In cases of equal-area projection the basic principle to be followed is that the product of scale factors in primary directions equals 1 (a*b = 1), whereas in cases of compromise projections the scale factors concerning primary directions are equal (a = b). Once again, it is worth noting at this point that scale factors of primary directions theoretically have a value of 1, regarding all points of any straight line depicted in the projection, as well as in specific points of the projection's surface (a = b = 1). This goes to show that there can be no cartographic projections that include and demonstrate both equal-area and compromise projection attributes. Inevitably all equal-area transformations depict geographic entities of different actual size as equal and compromise projections induce distortion regarding angles.
Lambert Conformal Conic Projection./ Image Source: en.wikipedia.org
Transformation of Distances
The accurate depiction of the Earth's surface on mappings is directly related to the preservation of the map scale consistency. In other words, in order to precisely project the distance between two given points of the planet's surface, Cartographers need to maintain the uniformity of the map scale across all points that the straight line representing the distance is comprised of. Furthermore, the map scale used must be absolutely equal to the primary scale of the reference sphere utilized, which gave birth to the transformation applied in the first place. Thus, Cartographers are left with two fundamentally different options in order to overcome the obstacle of precisely depicting distances. Let's not forget to mention that both options are highly relevant to the scale factor and the way Cartographers are able to manipulate its properties.
The first possible scenario includes the preservation of a scale factor across two or more parallel lines. The scale factor mostly applied equals 1,0 regarding all points included in the parallel lines, however this only applies strictly for those straight lines which basically means that nearby points that are not situated on the lines are probably depicted using different scale factors. Whenever this situation occurs, the straight lines mentioned above are also called primary lines or primary parallels. Regarding the second possible scenario, Cartographers attempt to maintain a scale factor of 1,0 in all directions regarding one or two specific, chosen points. It is worth mentioning that the scale factor is constant for those points and only. Such cartographic projections are also known as equidistant projections, while the points mentioned above are also referred to as primary points.
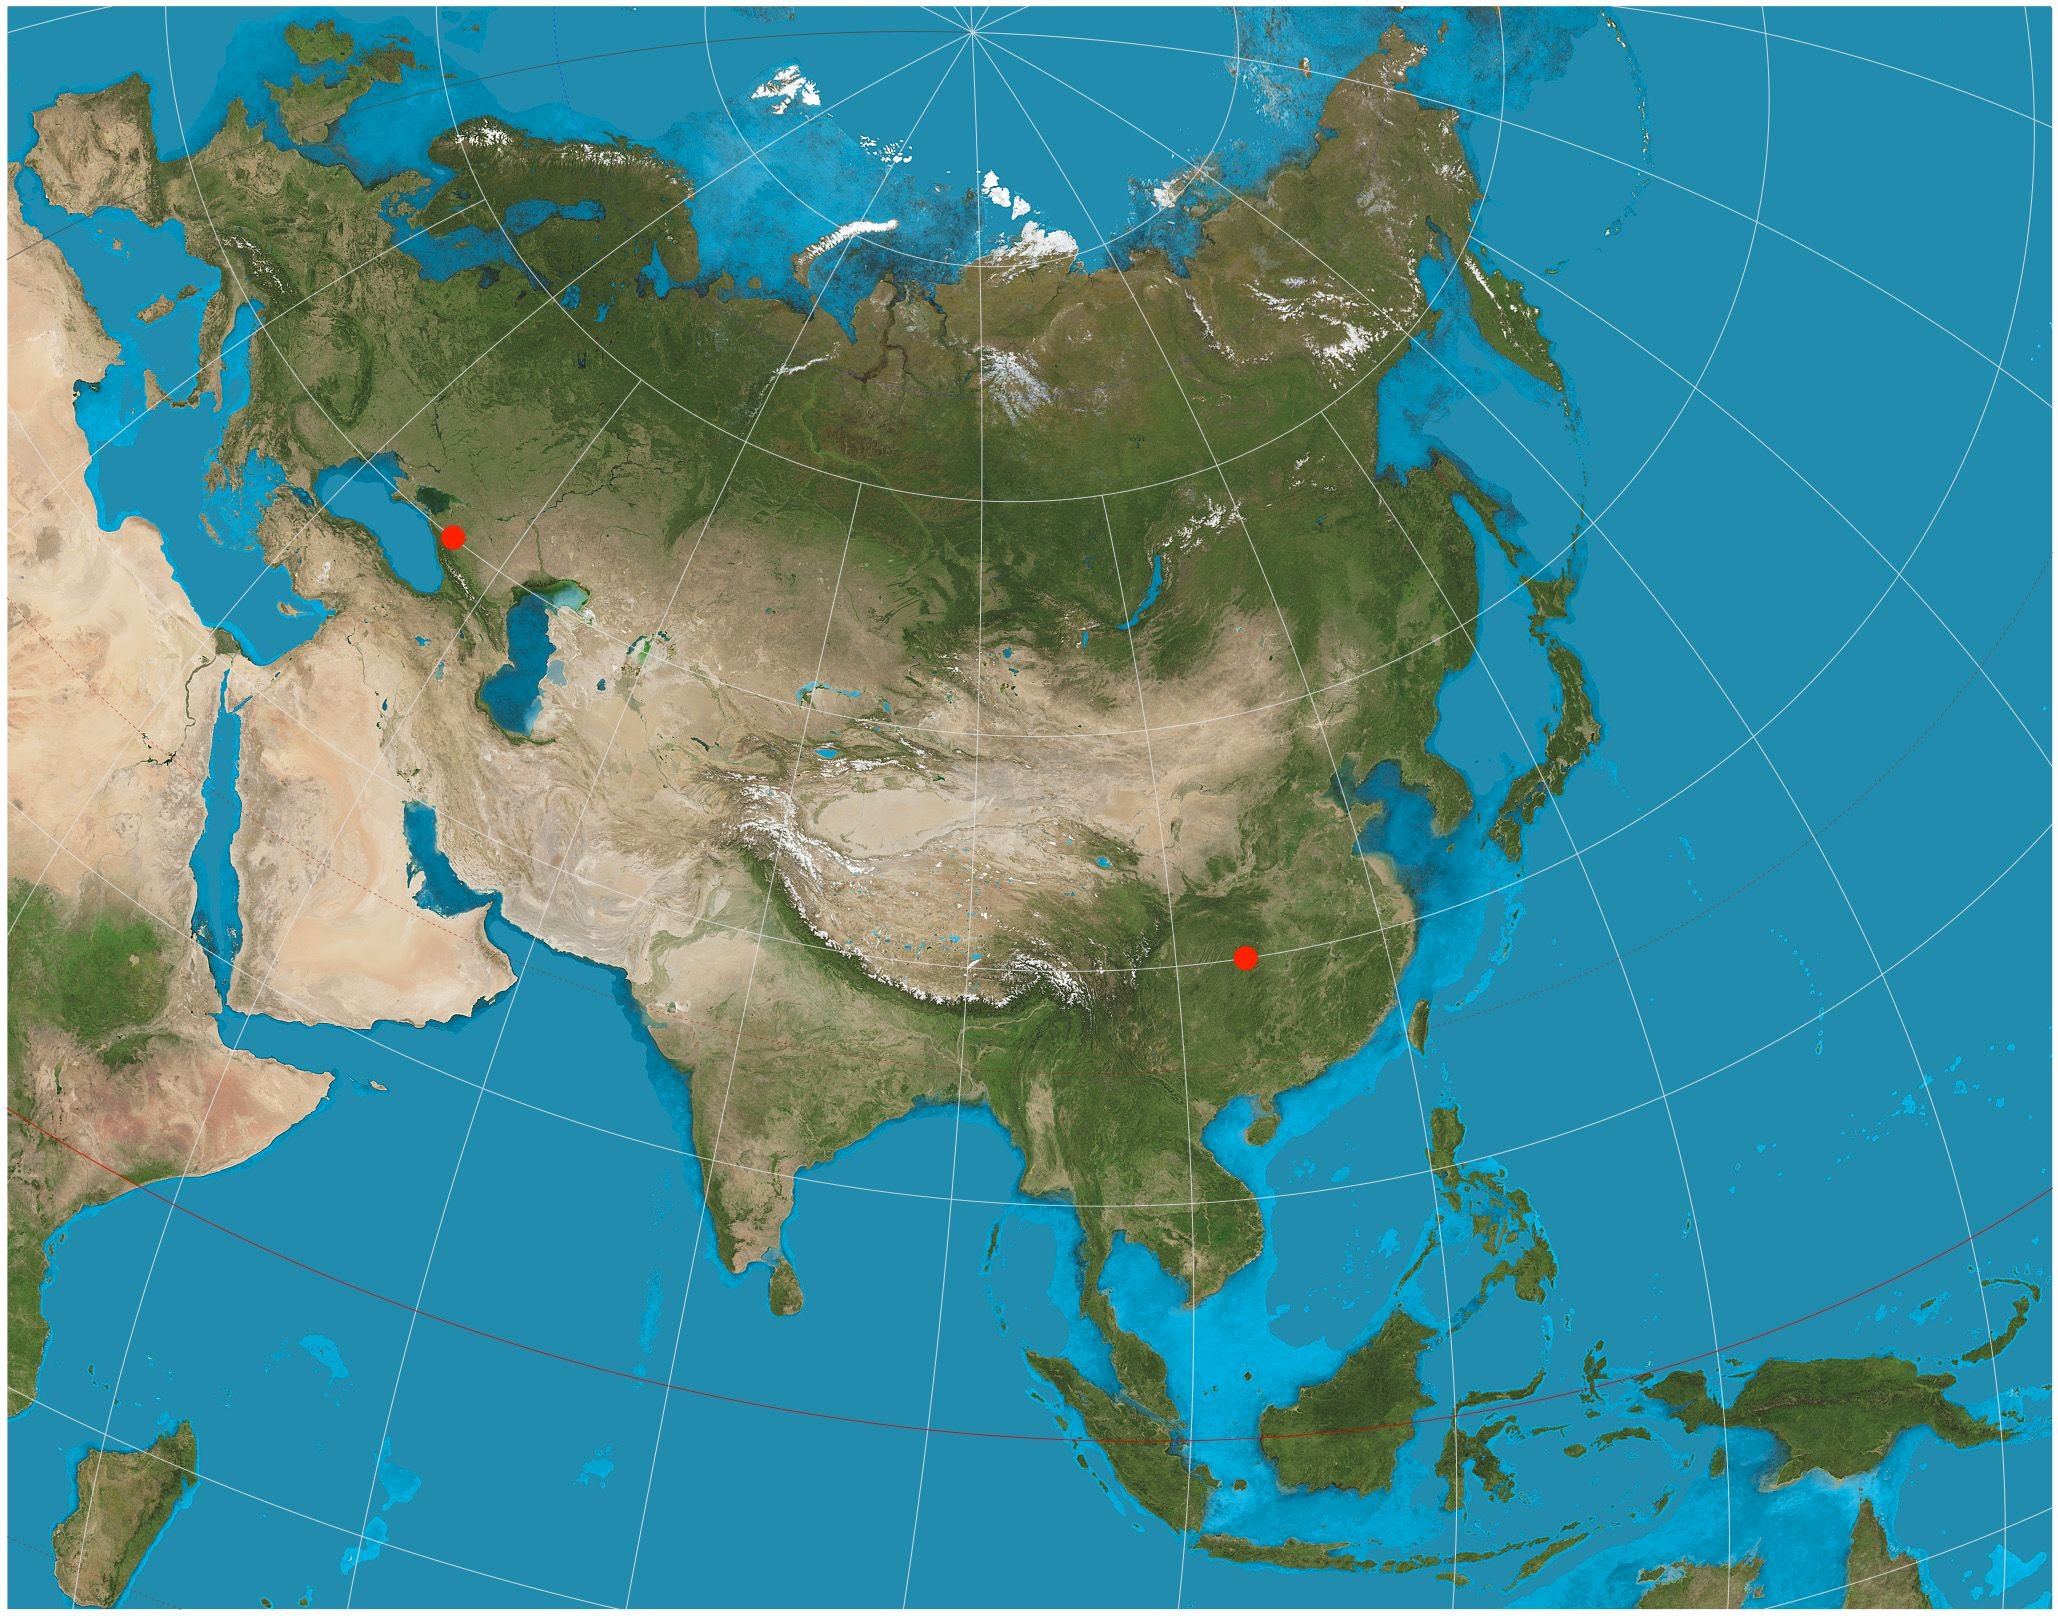
Two - Point Equidistant Projection of Eurasia./ Image Source: en.wikipedia.org
Transformation of Directions
It is impossible to depict all distances on a map with the exact same scale factor just like it is practically impossible to represent all directions precisely with the utilization of straight lines. It is a known fact that the distribution of scale factors can be adjusted so that trajectories with a constant azimuth angle can be depicted as straight lines, however there are no cartographic projections allowing the depiction of directions in a way that parallels are demonstrated as straight lines which intersect the paper gauge and the reference sphere at the exact same angle. Thus, Cartographers often assume that the primary direction in cartographic projections is that of a maximum circle (Parallel), depicted as a straight line. As a result, there are two different possbile scenarios regarding the precise demonstration of the arcs of maximum circles and the extraction of precise geographic information.
The first possible scenario includes the depiction of the arcs of maximum circles as straight lines for relatively small areas. In this case, there can be no accurate depiction of the angles at which Meridians intersect Parallels and therefore azimuth angles are not demonstrated efficiently and properly. As a result the process of transformation gets much more complicated than usual, making the transformation sufficiently effective for a total area smaller than the planet's hemisphere. The alternative option is to accurately depict the arcs of maximum circles by maintaining precision regarding azimuth angles. This brings the desired outcome of representing arcs as straight lines regardless of direction. Such projections are commonly referred to as azimuthal projections.
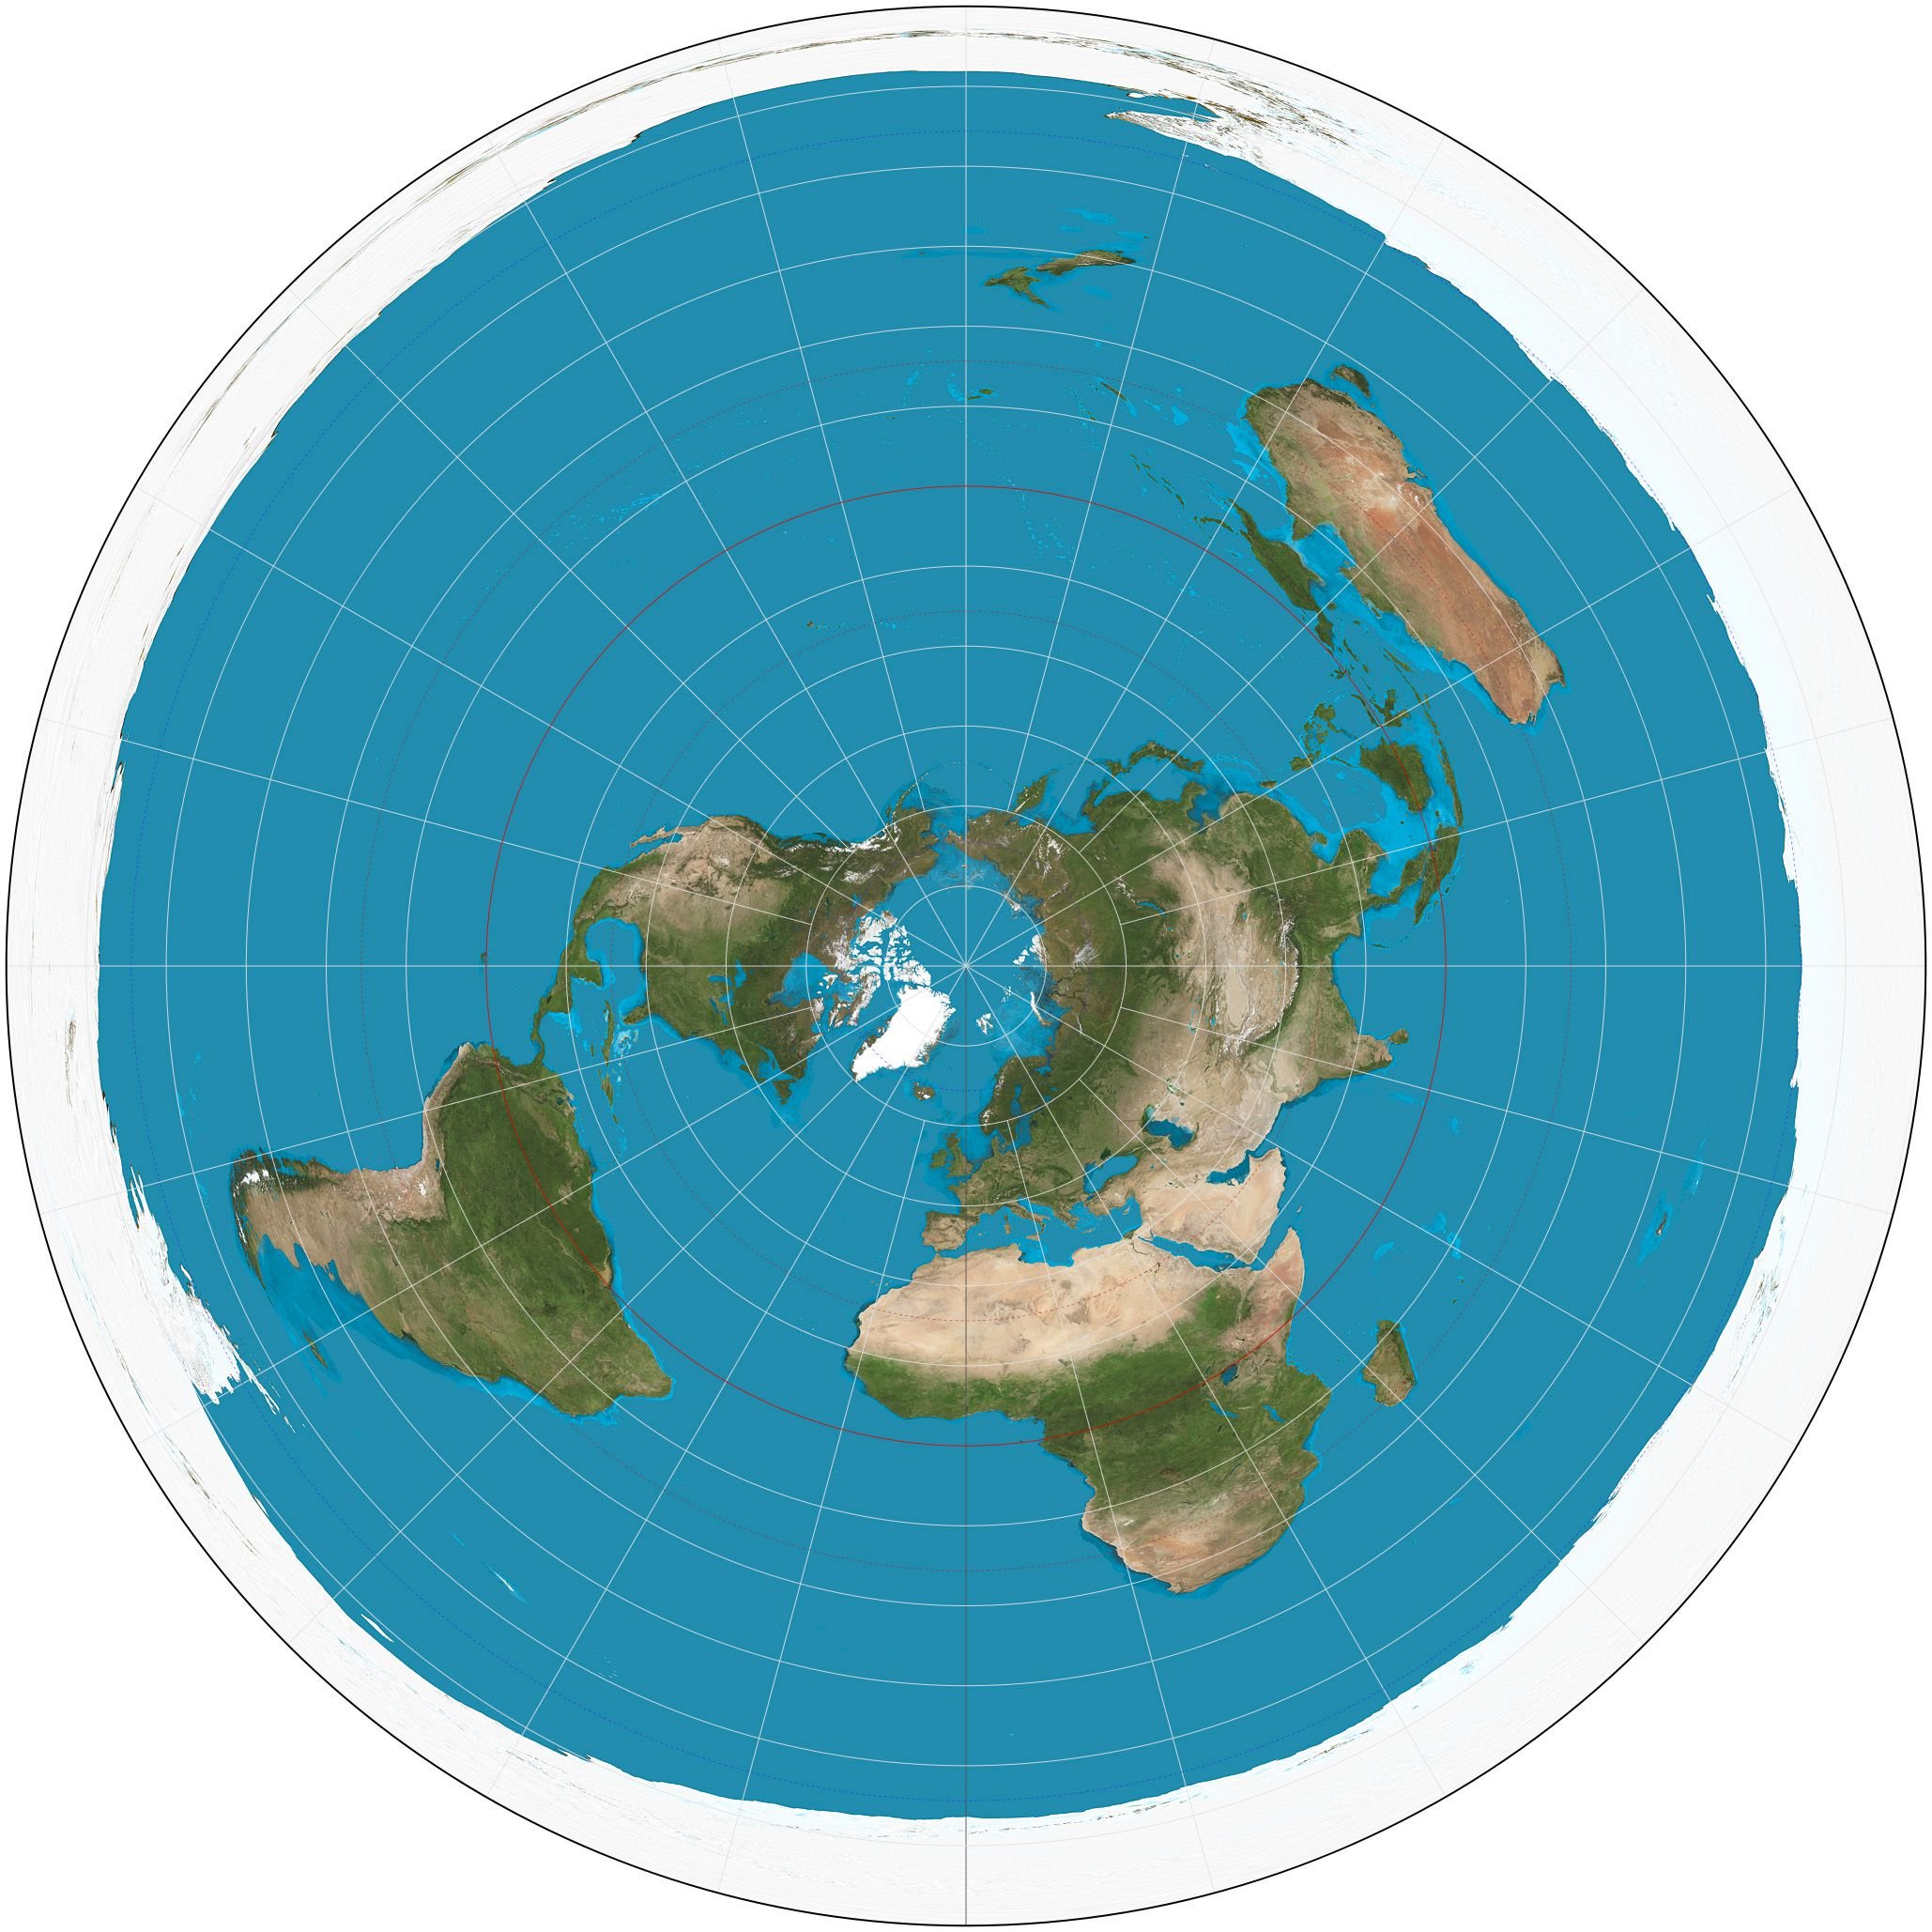
Azimuthal Equidistant Projection of the World./ Image Source: en.wikipedia.org
Alright, that's it for today, people! Hope you made it till this point. This brings us to the end of this third part regarding this Introduction to Cartography series. I promised I would be making three introductory posts, however I've decided to make two more of those as I want to share detailed technical information regarding cartographic projections. Projections are a vital part of the scientific field of creating 2D depictions of our 3D world so I need to treat those with respect and therefore create large and detailed, quality blogs. These posts are still introductory, however things might start getting a bit more nerdy in the near future. Stay awesome and tuned! :)

IMAGE SOURCES:
REFERENCES:
University Textbooks & Course Lectures:
Χαρτογραφία Ι/Cartography I -TSOULOS LYSSANDROS (National Technical University of Athens, School of Rural & Surveying Engineering Course Lecture Notes)
Στοιχεία Χαρτογραφίας, Πανεπιστημιακές Εκδόσεις Ε.Μ.Π. /Εlements of Cartography, University Publications NTUA - ROBINSON, MORRISON, GUPTILL (National Technical University of Athens, School of Rural and Surveying Engineering University Textbook)
Ψηφιακή Χαρτογραφία/Digital Cartography -SKOPELITI ANDRIANI (National Technical University of Athens, School of Rural & Surveying Engineering Course Lecture Notes)
Internet Links:

Thank you for your attention!
Hope you enjoyed this post and did learn a thing or two.
Follow me and stay tuned for more engineering blogs.
Highest Regards
@lordneroo