Some graphing software or calculators (on a certain mode) can plot curves only when y is expressed as a function of x. So how do you plot vertical lines? The answer is that you cannot. It is impossible.
However ...
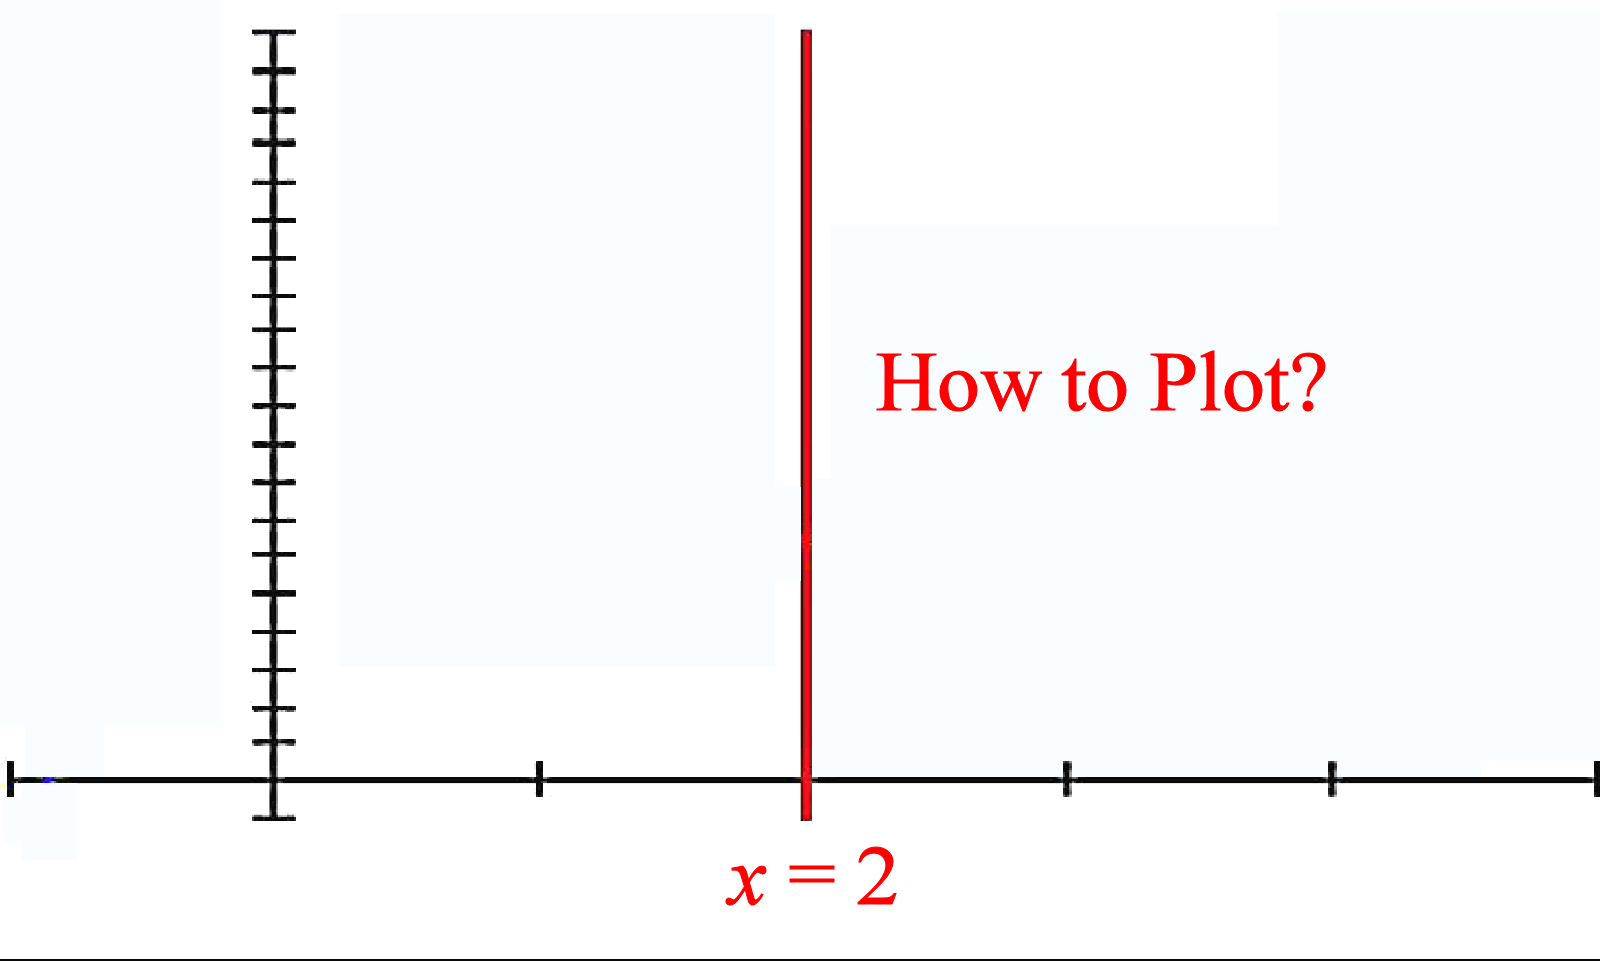
there is a trick you can use. A vertical line, by right, has "infinite" gradient. Instead of using lines with literally infinite gradient, we can use lines with very high gradients e.g. 99999. If we want to simulate a vertical line x = d passing through the x-axis at (d, 0), we can use the equation y = 99999(x - d). You can easily check that this straight line has a gradient of 99999 and when x = d, y = 0.
For the purpose of visualising the definite integral , I want to draw the vertical lines x = 2 and x = 4 onto my TI-84 Plus C Silver Edition (Emulator). So I keyed in the equation for the curve, as well as y = 99999(x - 2) and y = 99999(x - 4) into the equations panel.
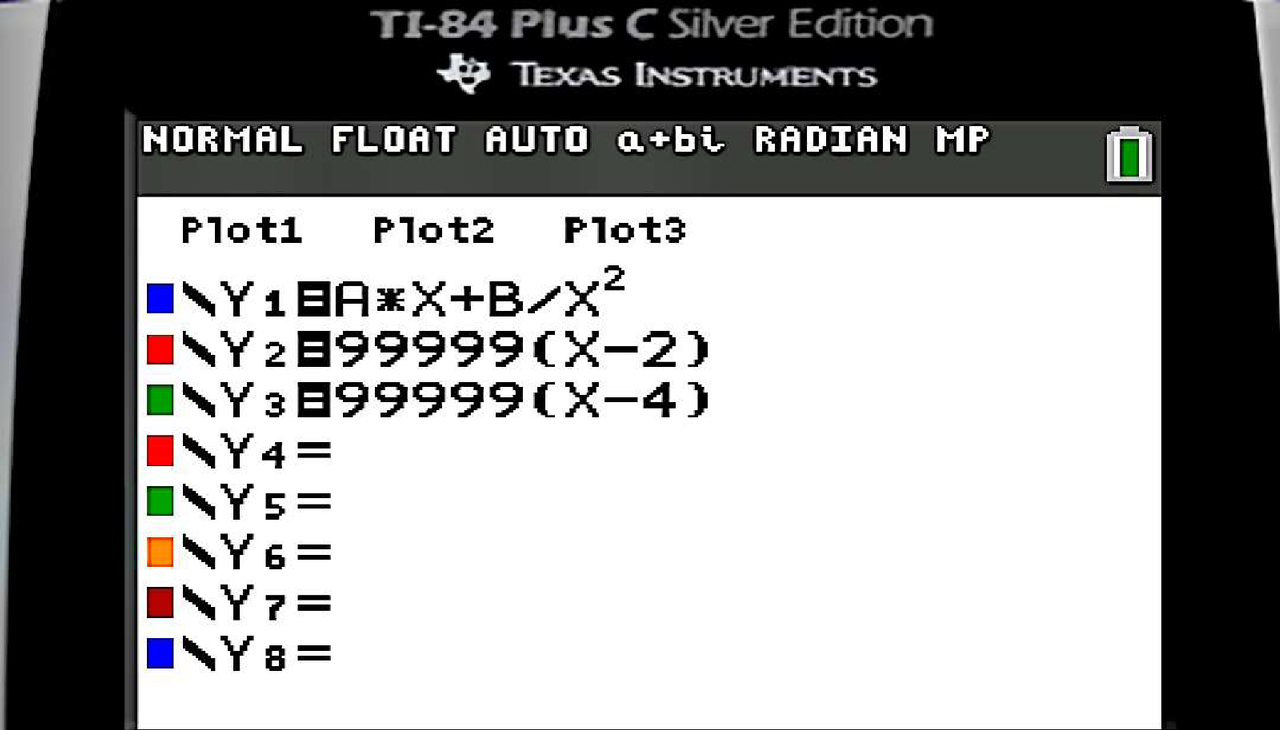
And here is the result.
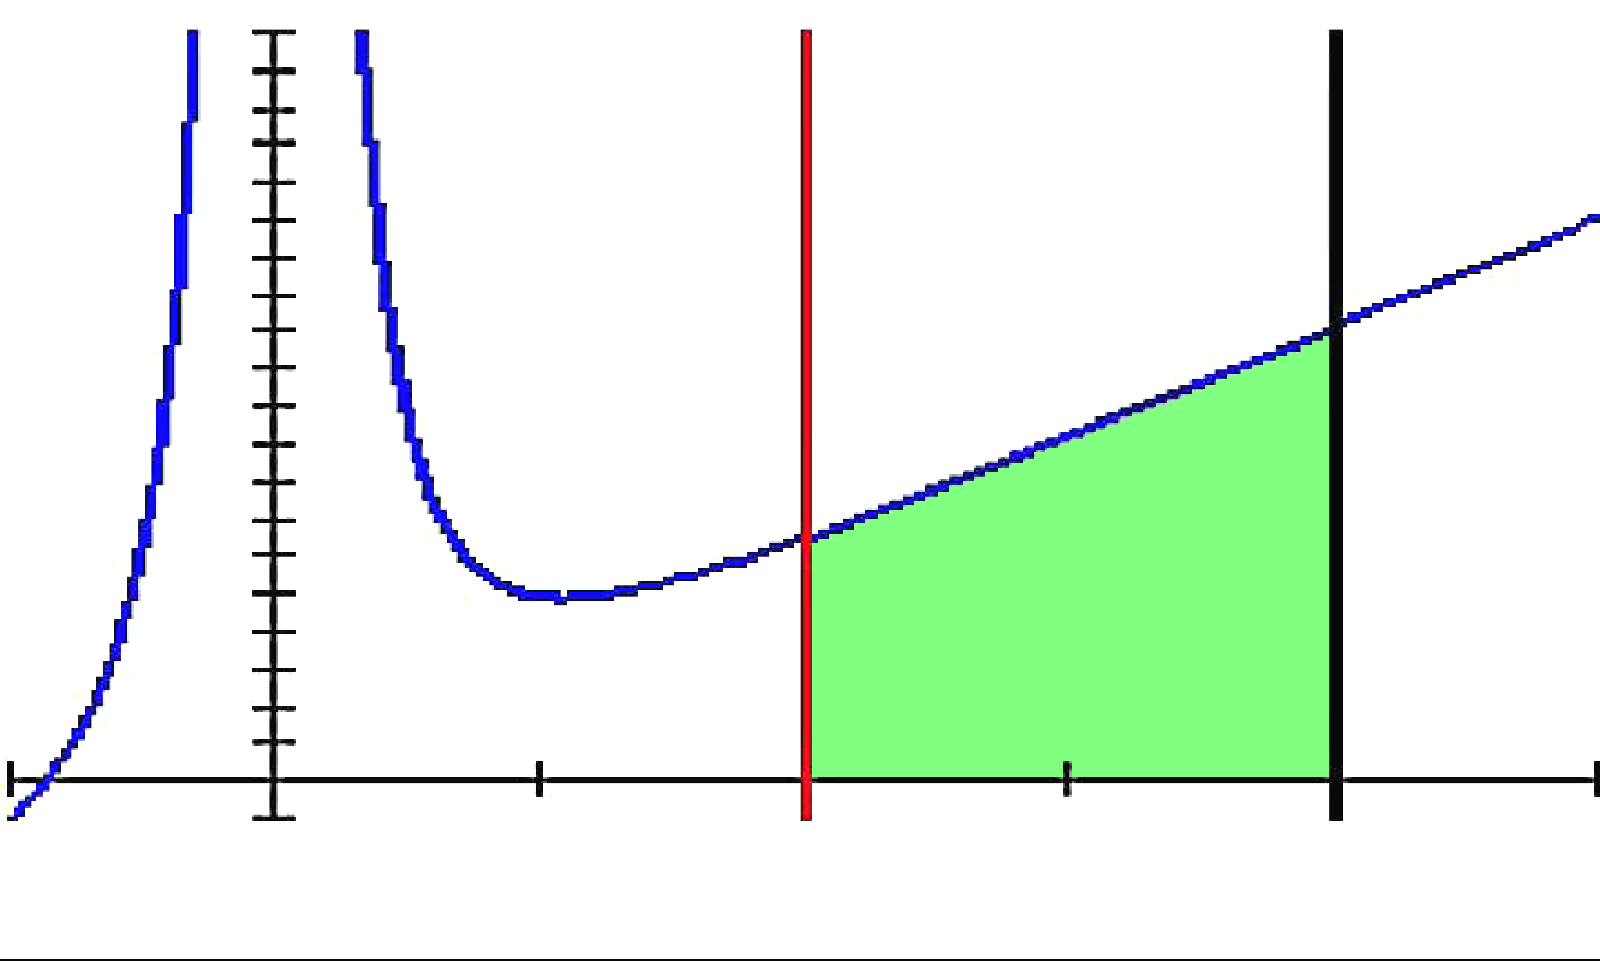
The green colour to shade the region of interest was added for fun, and was not in the original output. This trick should work for any other graphing calculator and software.
By the way, TI-84 has another mode, the parametric mode in which drawing of x = d can be drawn easily via x = d and y = t (parameter). However, I did not want to change mode.
Anyway, I have proven that
"The impossible we do at once. Miracles take a little longer".
Announcements
You might also want to read my recent posts:
Visual Division of Non-Unit Fractions
The Sharp Mathematics Contest #2 -- Winners
If you find my articles useful or interesting, please upvote and resteem them! Thanks !
Cheers!!!
@tradersharpe
-- promoting sharp minds