In my current work at the European Space Agency, I work to help foster innovation around the use of satellite applications. It is a very exciting area that is currently seeing explosive growth. This both due to new companies like SpaceX providing cheaper access to space for more actors, but even more so due to advancements in computer science. As a result, the true potential of Earth Observation satellites is only being unlocked now. Because while still images of the Earth have provided useful insight, it is only when they are combined with Big Data analytics, cloud computing, and machine learning algorithms that resulting applications become truly disruptive.
Here are some examples of exciting new areas where satellite data are about to change everything:
Autonomous detection and reporting of sinking and damaged infrastructure
Most of you are likely to be familiar with imaging satellites. A less known type of satellites are those equipped with radar, or InSAR instruments to be precise (short for Interferometric synthetic aperture radar). Where satellite imagery is often referred to as “passive remote sensing”, as they only receive light that has been reflected off the surface of the Earth, InSAR satellites are a form of “active remote sensing”. This because they actively send radar signals towards specific points on the ground. These signals are then reflected back into space and received by the satellite which measures the time interval between sending and retrieving information. Based on this, we can know the distance to the ground down to millimetre accuracy. Based on this, we can measure the shapes of structures and see how they change over time. The technique has been used increasingly with new emerging InSAR satellites. Below is a radar-map of Norwegian capital city Oslo prepared by the Norwegian Geological Survey.
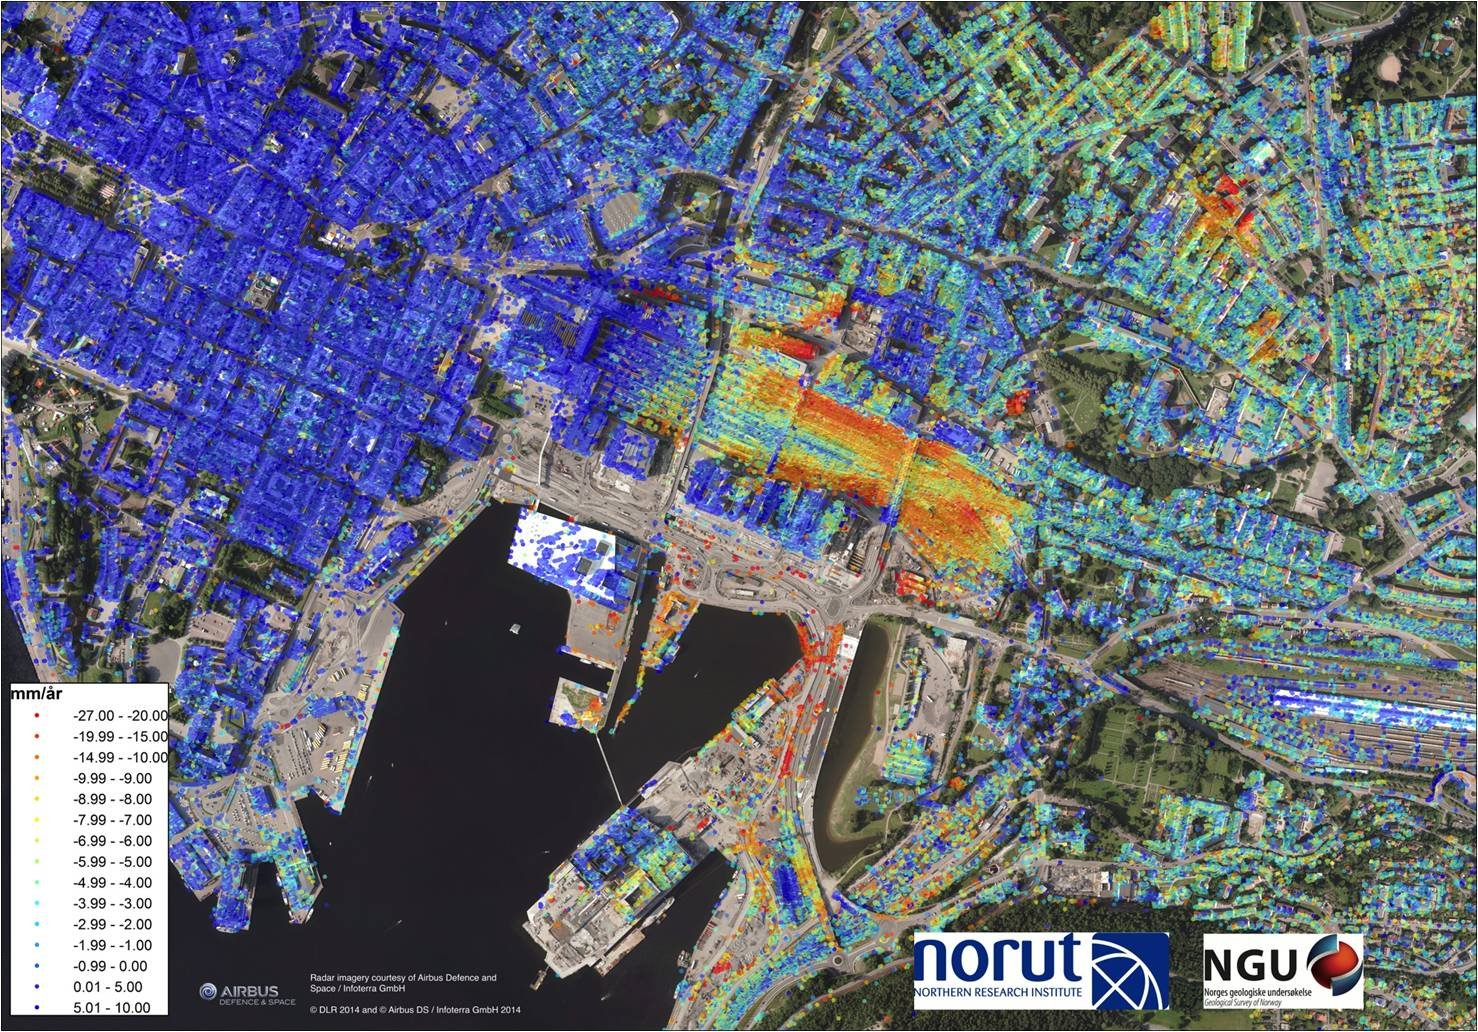
Red dots indicates a decrease in height, suggesting that the ground is sinking!
This information uncovers information, at scale, with high value to urban planners, real estate investors, and insurance companies among others. First of all, it shows where the ground is sinking, allowing for more clever infrastructure investment plans, as well as the knowledge of where infrastructure such as water pipes may break. Moreover, some of the red dots have been shown to represent damage done to infrastructure, where the reduction in height is due to crumbling supporting infrastructures as seen in two different cases below.
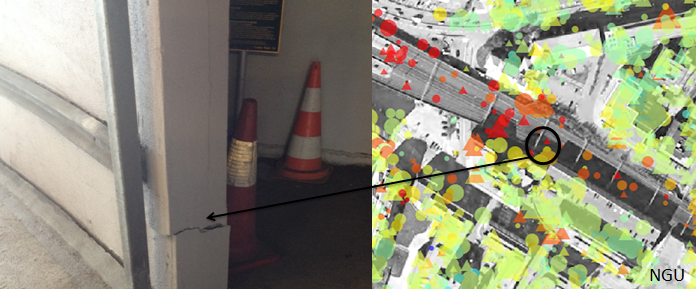
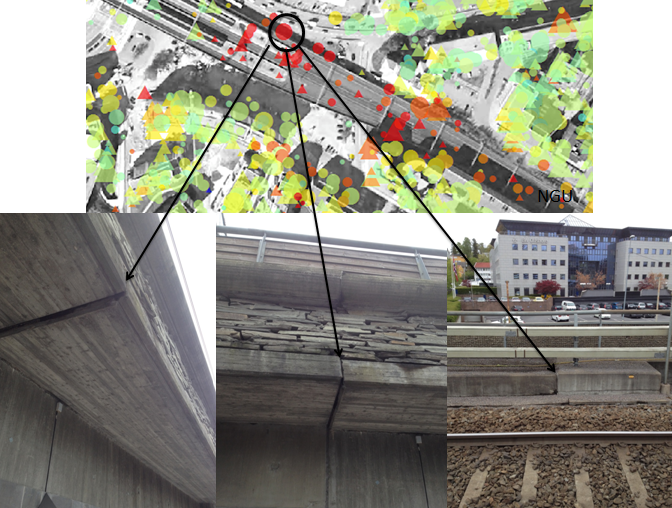
In some instances, a red dot on the map were found to have occured due to crumbling infrastructure
Now, just take a pause and think about it for a minute: There are changes going on at ground level in the middle of a wealthy Capital which we cannot detect with our human eyes, but a piece of hardware flying 700 000 meters above the ground at 27 000 km/h can accurately spot! Quite unbelievable. And this technology is still only at the beginning. As the new InSAR satellites produce more data, and data scientists obtain more examples of subsidence caused damages, machine learning can begin to do wonders. So perhaps in the future, road maintainers will know where there will be a hole in the road 1-2 months ahead of time, and can make initial fixes rather than reactive damage repairs. Saving millions annually.
Autonomous detection and reporting of deforestation and forest fires
One of the major uses of satellite imagery is to monitor the health and status of forests world-wide. Different sensors provide different types of information that are all useful in different ways. InSAR images provide information about the height of trees, optical images can spot the difference between vegetation and land, and thermal infrared sensors can view land surface temperatures. All have different use-cases for spotting deforestation or forest fires.
On the image below, you can visibly see the red glow from up to 4 active fires, as well as the smoke and scars to the landscape.

Landsat 8 false colour image of wildfires and burn scarring in the vicinity of Fort McMurray, Canada, May 12 2016
Find it fascinating? See the ultra-high resolution image at nasa.gov. Make sure to enlarge the image and zoom in for some impressive details!
Organisations like Global Forest Watch make active use of such satellite images to provide a free and open portal for real-time tracking and reporting on illegal forestry, deforestation, and forest fires. The goal is to provide the ability to anyone, anywhere, with an internet connection and an interest in protecting the world’s forests, to know what is going on at any given time. The platform seeks to empower local communities anywhere with the information needed to better manage and conserve their forests.
On their interactive website, you can monitor any activities currently going on, or watch historical data going back 16 years.
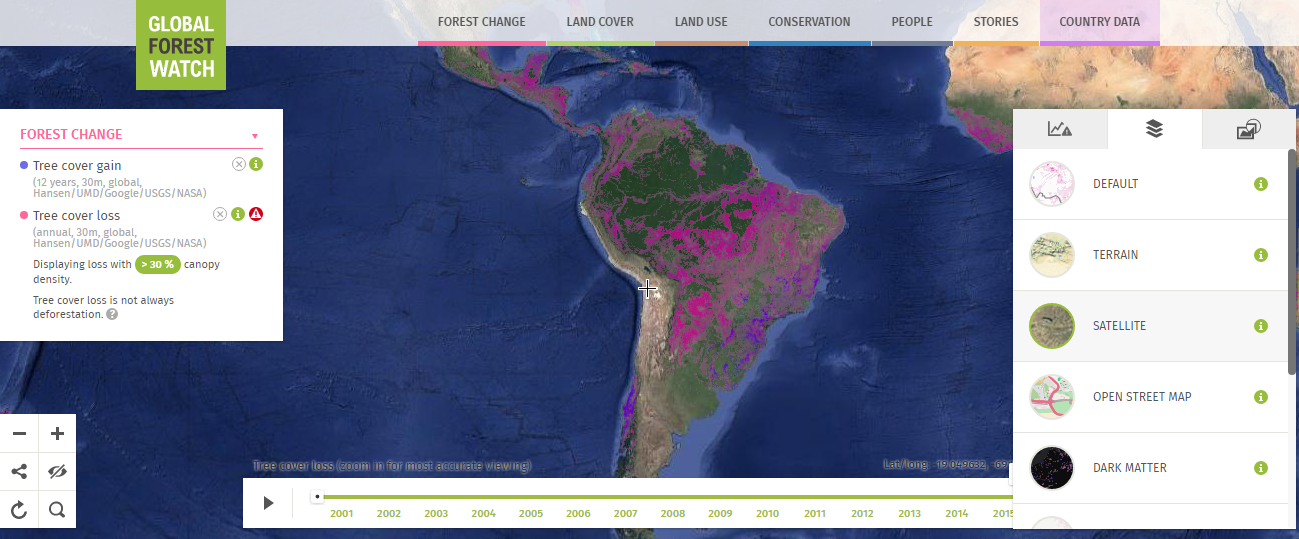
Screenshot taken from the maps service of GFW showing deforestation done in Brazil since 2001. Image also shows the efforts done alongside the East coast to plant new trees
As more forest fires and instances of deforestation is observed and recorded, the machine learning algorithms get increasingly good at identifying, and sometimes even predicting, deforestation and forest fires quicker and quicker. Thus helping us combat deforestation and assist more quickly when forest fires occur.
Measuring and forecasting GDP growth based on nightlights seen from Space
In Japan, a financial research and technology startup named Nowcast Inc, is developing an IT product to estimate economic growth, in real time, using satellite images of night-time lights. This is done by pairing several satellite images, with a measurement of the strength of illumination, with a range of published statistics on industrial production and trade from the same region in the same time period. Machine learning algorithms are then able to find patterns between illumination and industry activity in a region. The result is an ever-improving model capable of accurately forecasting changes in gross domestic product (GDP) in different regions by importing satellite images alongside other public data.
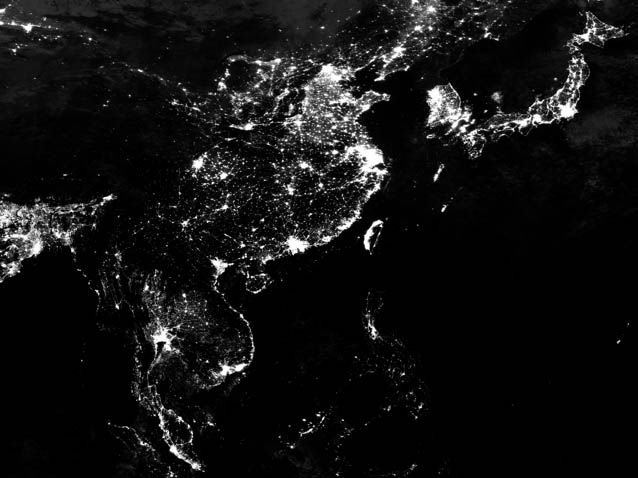
Light illumination from the cities of Japan and East Asia
The company already provide real-time inflation data and is now aiming to start publishing forecasts for economies including Japan, the US, China, India and Taiwan. They will then be seeking to sell the service to investors who currently rely on GDP figures that are released weeks after the end of each quarter.
“Testing in Japan has shown the product to be more accurate than economist surveys compiled six weeks before growth statistics are released” Chief Executive Officer Ryota Hayashi
Now, imagine what this could mean for an investor looking to invest in developing countries where accurate data on economic growth hard to come across and often not very reliable.
Did you find this fascinating? Be sure to Follow for more as I look to make this a regular series!
You may also want to check out my other series on Beautiful Satellite images you won't believe are real
Thank you for reading this far! My next posts will cover:
- “My interviews with 25 Astronauts, and what it taught me about life, our planet, and much more”
- “So I built and launched a Pink rocket at NASA Kennedy Space Center”
See you then!