In my current work at the European Space Agency, I work to help foster innovation around the use of satellite data. It is an exciting area that is currently seeing explosive growth. This both due to companies like SpaceX providing cheaper access to space, but more so due to advancements in computer science. The true potential of satellite imagery is only unlocked now thanks to Big Data analytics, cloud computing, and machine learning algorithms. Moving us from interpreting still-images, to using the continuous flow of image data as input to produce new services.
Here are some examples of exciting new applications that are both cool and disruptive:
Measuring the world’s Oil reserves
A significant amount of the world’s wealth is stored in oil reserves. More importantly, changes in the size of these reserves – the equivalent of changes in oil supply – heavily affect the price of oil. Having a good overview of the number of storage facilities, and their current size in close to real time, is therefore heavily in demand for many different reasons.
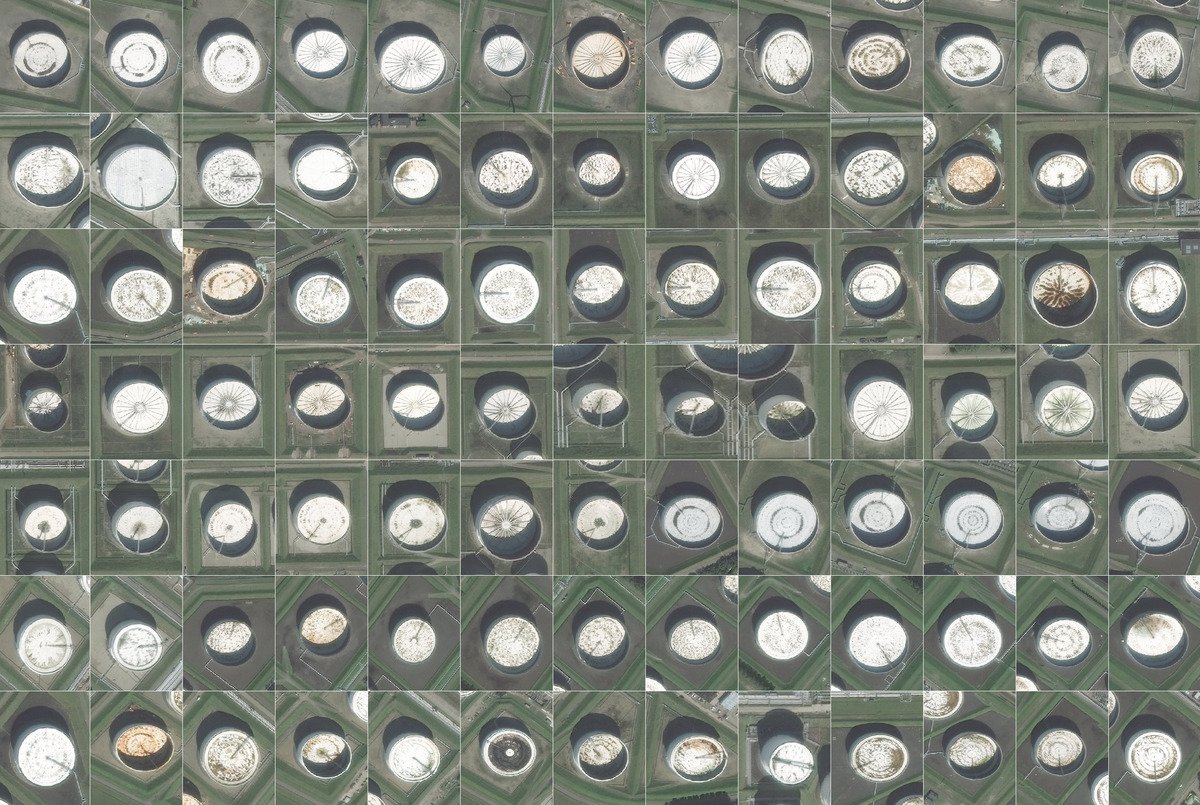
A compilation of satellite images of oil storage facilities around the world
source
Imaging satellites, even with medium scale resolution, provide fairly good images of oil storage facilities from space. More importantly, with the rapid increase in the number of satellites in orbit, the update frequency of images allow for a regular update of images. Computers are then fed this image data, which can provide some disruptive information services on one of the world’s most important assets. Once a machine learns what an oil storage facility looks like, it is piece of cake to autonomously detect these in images. First, the computer saves the location of all oil facilities in the world, and which country borders they fall within. Secondly, it can make a very precise estimate of the size of the facility by measuring its diameter directly before estimating its height based on the size of the shadow it casts on the ground. While the shadow on the outside gives a hint of the size of the tank, the shadow on the inside provides knowledge on how full it is. The larger the shadow, the emptier it is.
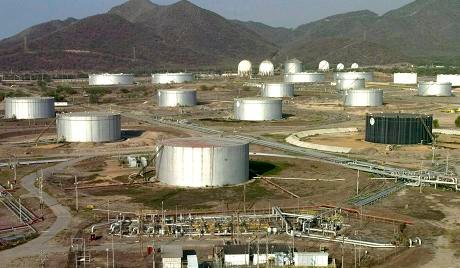
source
Thus, satellites can give very powerful information about the economic state of a country that is dependent on oil. Furthermore, as oil and gas prices are mainly dependent on the size of available reserves (the supply), this provides unique insight into the expected development in the price for crude oil short term. Indeed, the price of oil tends to fluctuate heavily whenever this information is revealed to the market. In mid-June this year, oil prices fell heavily when it was known that American oil reserves were larger than the market had thought source.
Holding information about this before the rest of the market could allow investors to make big gains by betting against the market’s expectations. As numerous industries and investors depend on this information, obtaining this through satellite images have disruptive power on both trade and business.
Detecting and monitoring dangers of avalanches
InSAR satellites, combined with interferometry processing of the data, allow us to detect changes in the height of the ground down to millimetre precision. The way satellites do this is by actively sending radar signals down towards specific points on the ground. These are then reflected back into space and received by the satellite, allowing the satellite to measure the time it takes for the signal to come back. This is then used to measure the distance to the ground. Because this is done repeatedly over the same points on Earth, we can tell if the distance has changed since the previous measurement was taken. The resulting data can have numerous applications, one of which is to see the changes in rock structures of mountains. Below you can see one such example from Lyngen in northern Norway.
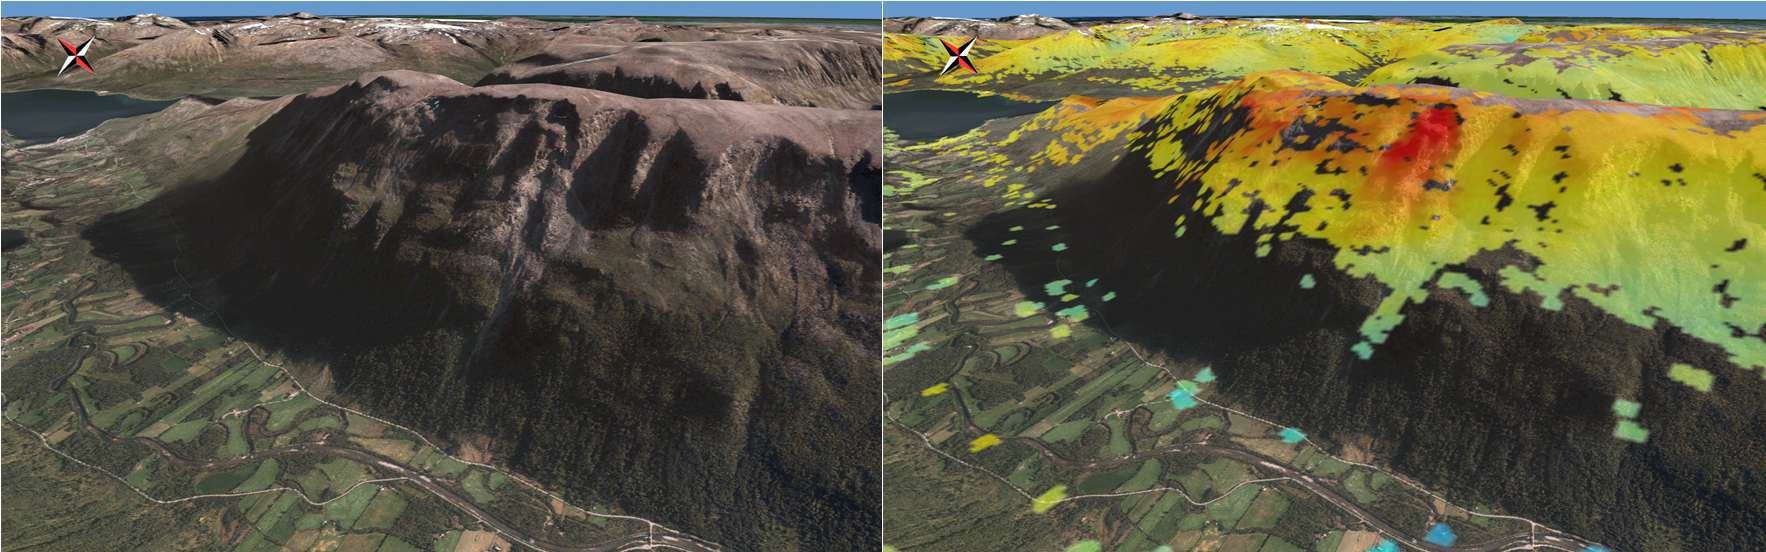
Adding a layer of InSAR processed data on top of this image of Lyngen, Norway reveals which parts of the mountainside are in motion.
As you can see, some parts of the mountains in the centre of the processed image show a stronger red colour than the rest. This indicates that the change in height has exceeded a specific number (typically more than a centimetre) over the past months. Combining this measuring capability with machine learning is where things really get interesting. Computers that are fed this data get increasingly good at recognising patterns that correlate with subsidence. Alerts can then be triggered when a given level of subsidence has been observed in a mountainous area, allowing us to know ahead of time if there is a risk of avalanches and rockfall. People can then be evacuated in time, or supportive structures can be built to prevent a landslide altogether, or at least protect local infrastructures and houses. Saving lives and costs.
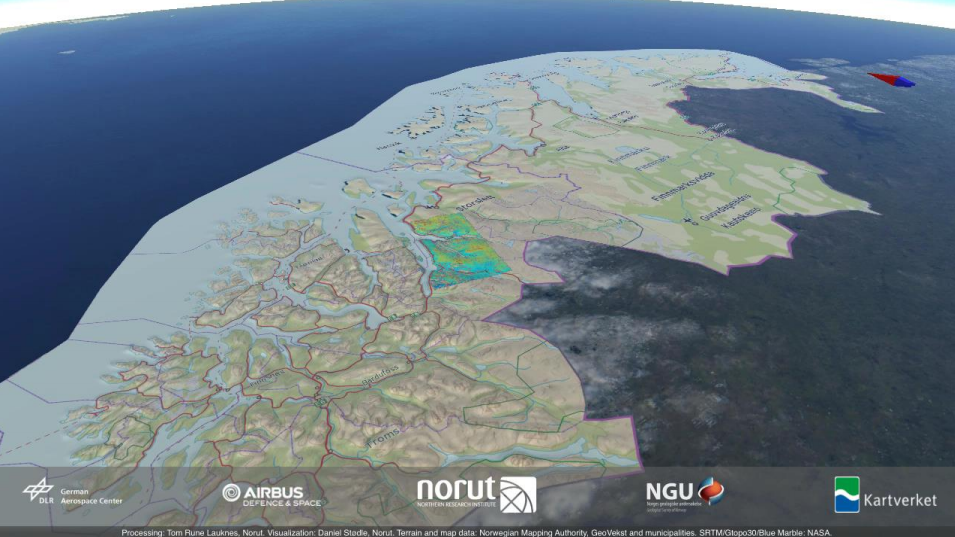
Avalanche monitoring in Troms, Norway source
Because satellites are global and revisit the same areas continuously, surveys such as these can be done autonomously for entire countries week-in week-out. The image above shows deformation mapping of parts of a region in northern Norway. This can potentially be done autonomously for entire countries, continents, or indeed the world. Work is currently in progress by the Norwegian Geological Survey to have a national level, frequently updated, deformation mapping service which new applications can be built upon by developers.
Detecting and monitoring algae blooms
Algae blooms is an interesting phenomenon to study for a few different reasons. This is particularly useful for inland waters, which are one of the most precious resources to many communities around the world. Because they provide drinking water, fish, a source of irrigation for crops, means for recreation, as well as playing an important role in the local ecosystems, their health is of vital importance. Due to the potentially very dangerous toxins that it produces, Algae blooms can sometimes threaten all the above. This makes it important to take steps to monitor, predict and handle its occurrences.

NASA’s Landsat 8 Satellite observes a large algae bloom in Lake Erie, Northern US and southern Canada source: NASA Earth Observatory_
I highly recommend having a look at the full-scale image to fully appreciate the detail and level of insight a satellite image like this can provide.
The image demonstrates the scale at which algae bloom can affect an area. As you can see from the image, there are numerous fields of agriculture surrounding the lake. These have most likely played a vital role in creating the algae bloom in the first place, as blooms are likely to occur when nutrition, often produced by agriculture, is made abundant in the lake.
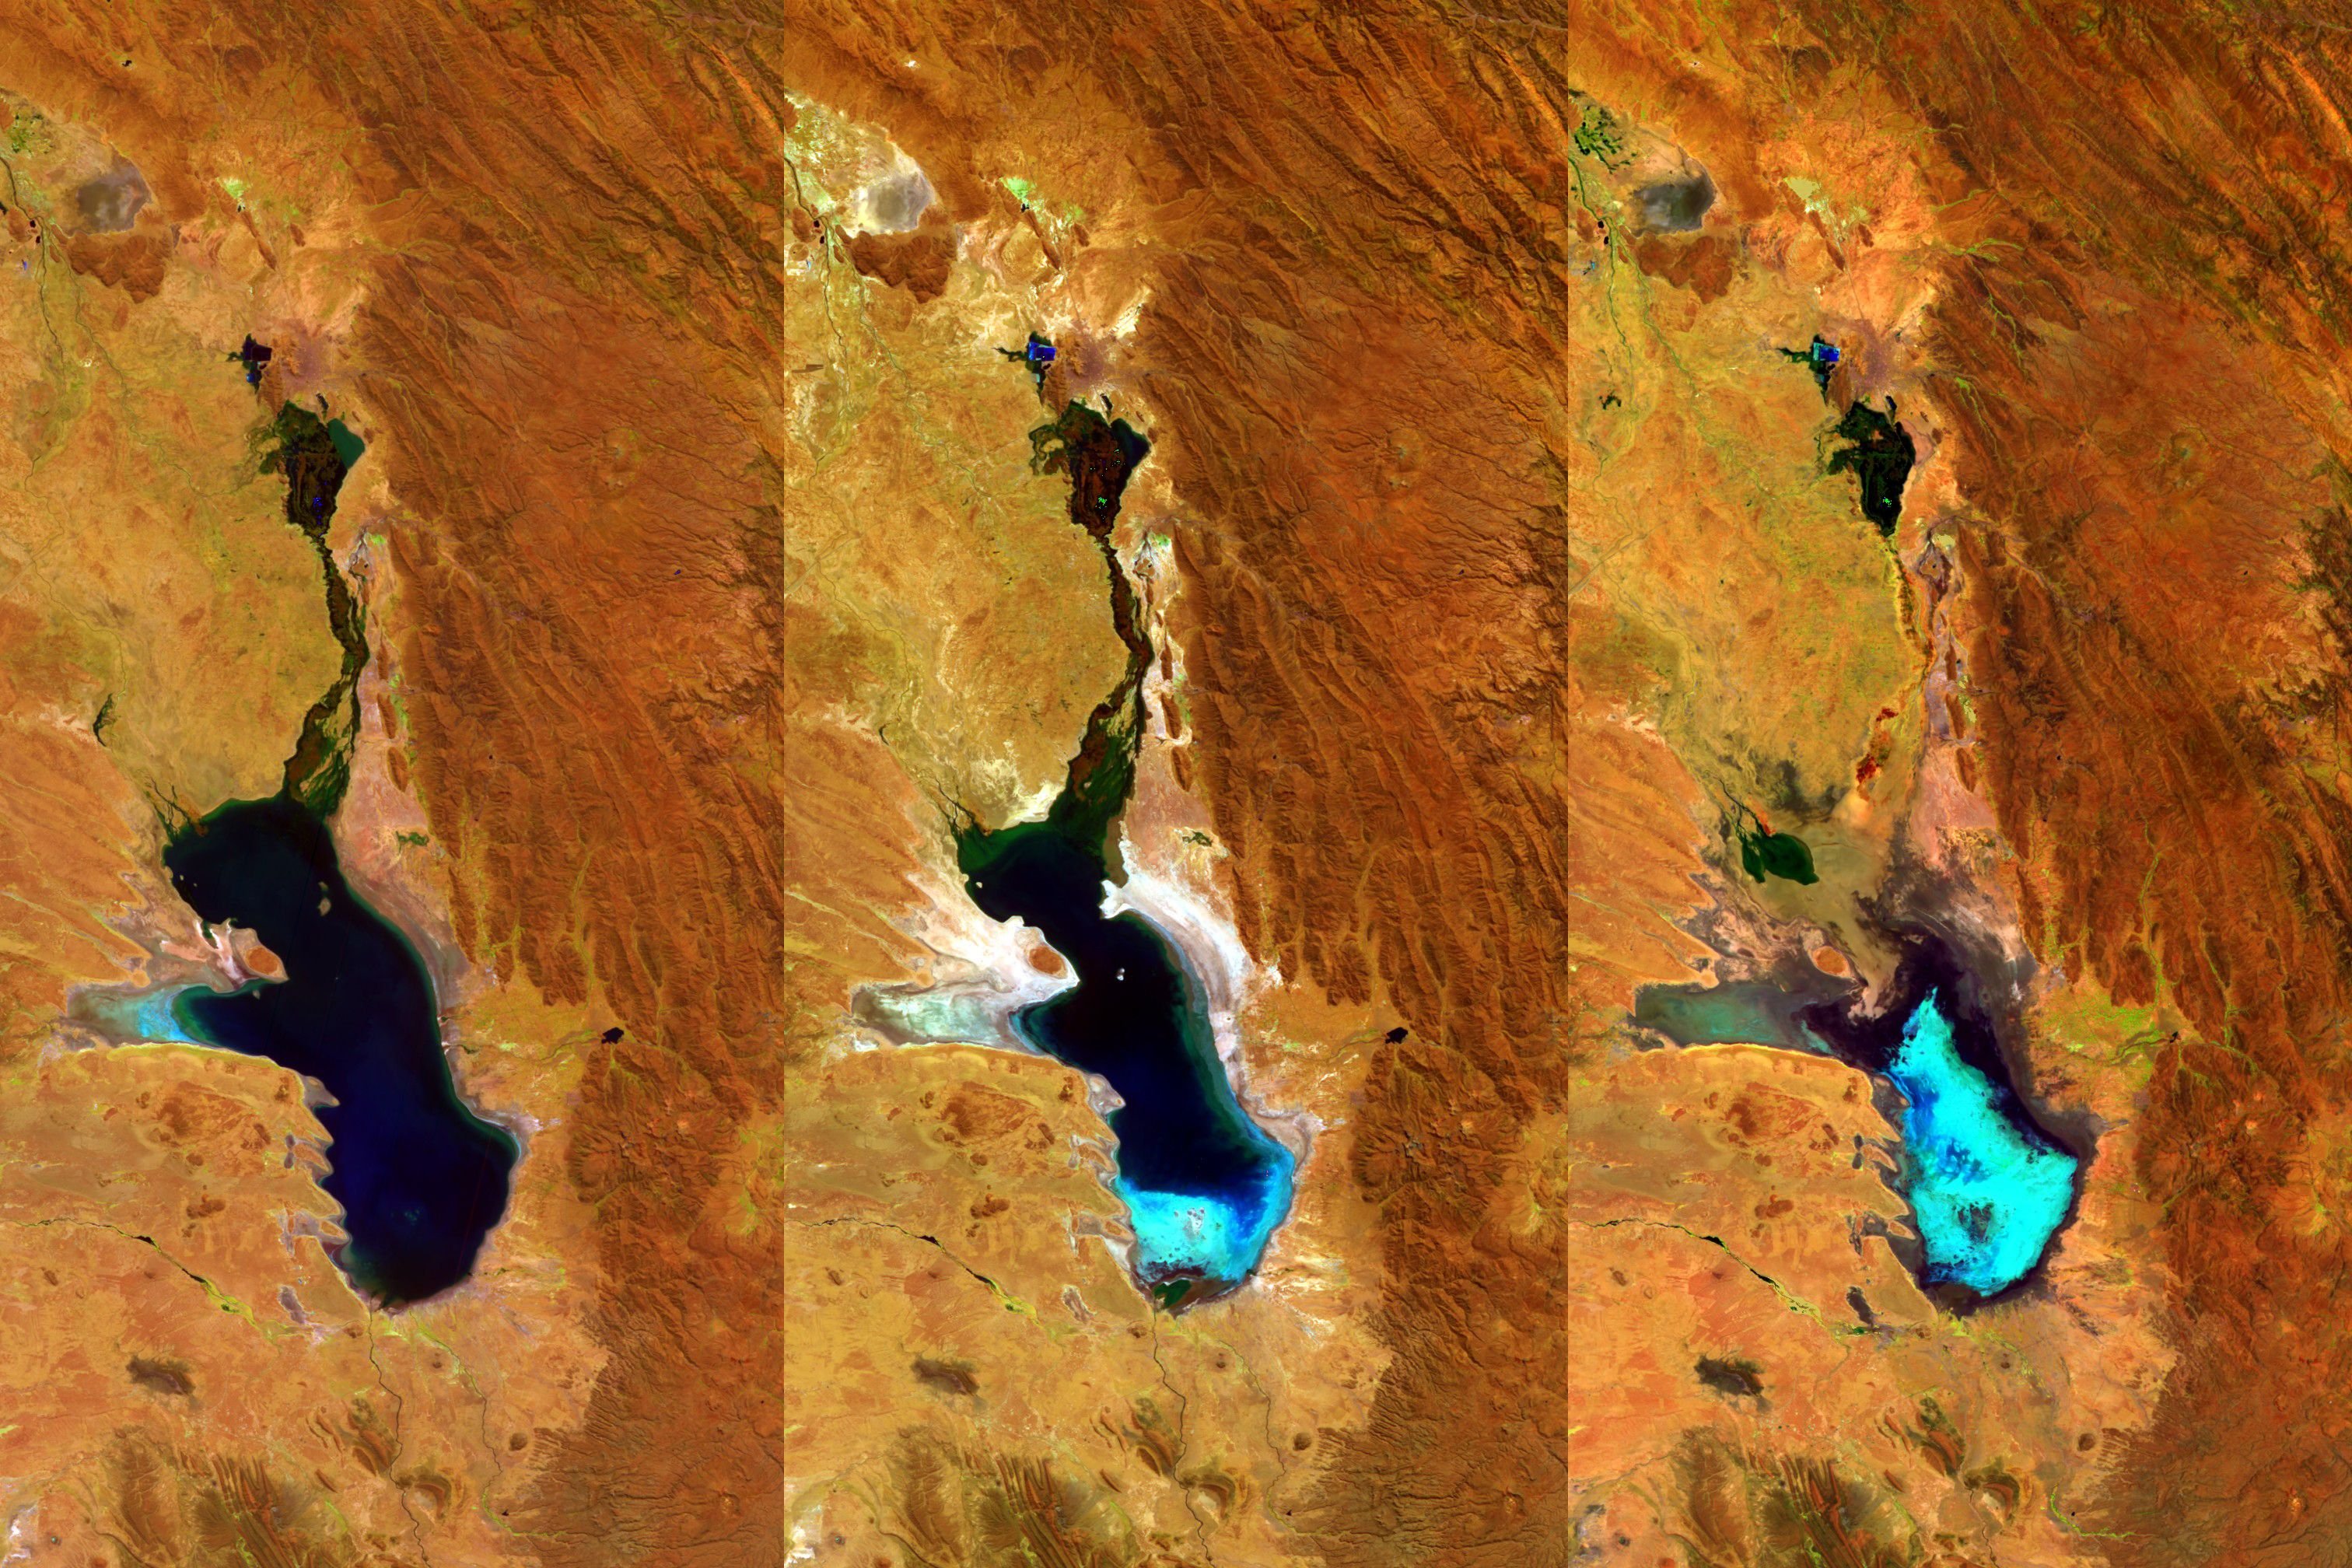
Compilation of Proba-V - the Fourth Satellite in the European Space Agency’s Proba series (V stands for Vegetation) - images tracking evaporation in Lake Poopó, Bolivia source
Contrary from here on Earth, from space, clear inland-waters appear rather dark because there is very little content in them to reflect colour back into space. This makes it easier to detect, and understand, the chemistry of algae and other plants or acids that absorb more light.
Information produced by satellites, combined with computing power to help spot early symptoms and alert of algae growth, can help assist local communities, perhaps in rural areas, deal more intelligently with the potential occurrences of algae blooms. Whether it be by treating the waters before it occurs, to dealing with the consequences of its occurrence.
Want to try processing new satellite images yourself?
Today, huge amounts of data are made freely available through the Copernicus programme run by the European Commission and the European Space Agency. You can download the raw data from their satellite constellation yourself for free here, which can be processed professionally by the free and open source tool snap.
Did you find this information fascinating? Make sure to Follow me for more, and look also into my Beautiful Satellite Images of our Planet you won’t believe are real where part #3 will be online tomorrow!
Steem on!
Fredrik / @fredrikaa