In my previous post, I discussed that we might expect a 'triangle pattern' to form during the recent downward consolidation period in Ethereum. I think it's fair to say that one did form(!), and that this resulted in a trading opportunity from the break upwards. Unfortunately, with all the activity surrounding BTC split and also with being a bit busy, I didn't get a chance to make a post about it at the time :( ... so apologies. However, I thought it still might be of some interest to discuss it (even if it's too late for trading the particular break-out point).

First thing I wanted to mention, though, was that in @xaero1/ethereum-ta-discussion-part-2-a-few-things-i-missed, I drew a possible sketch of what such a triangle could potentially look like:
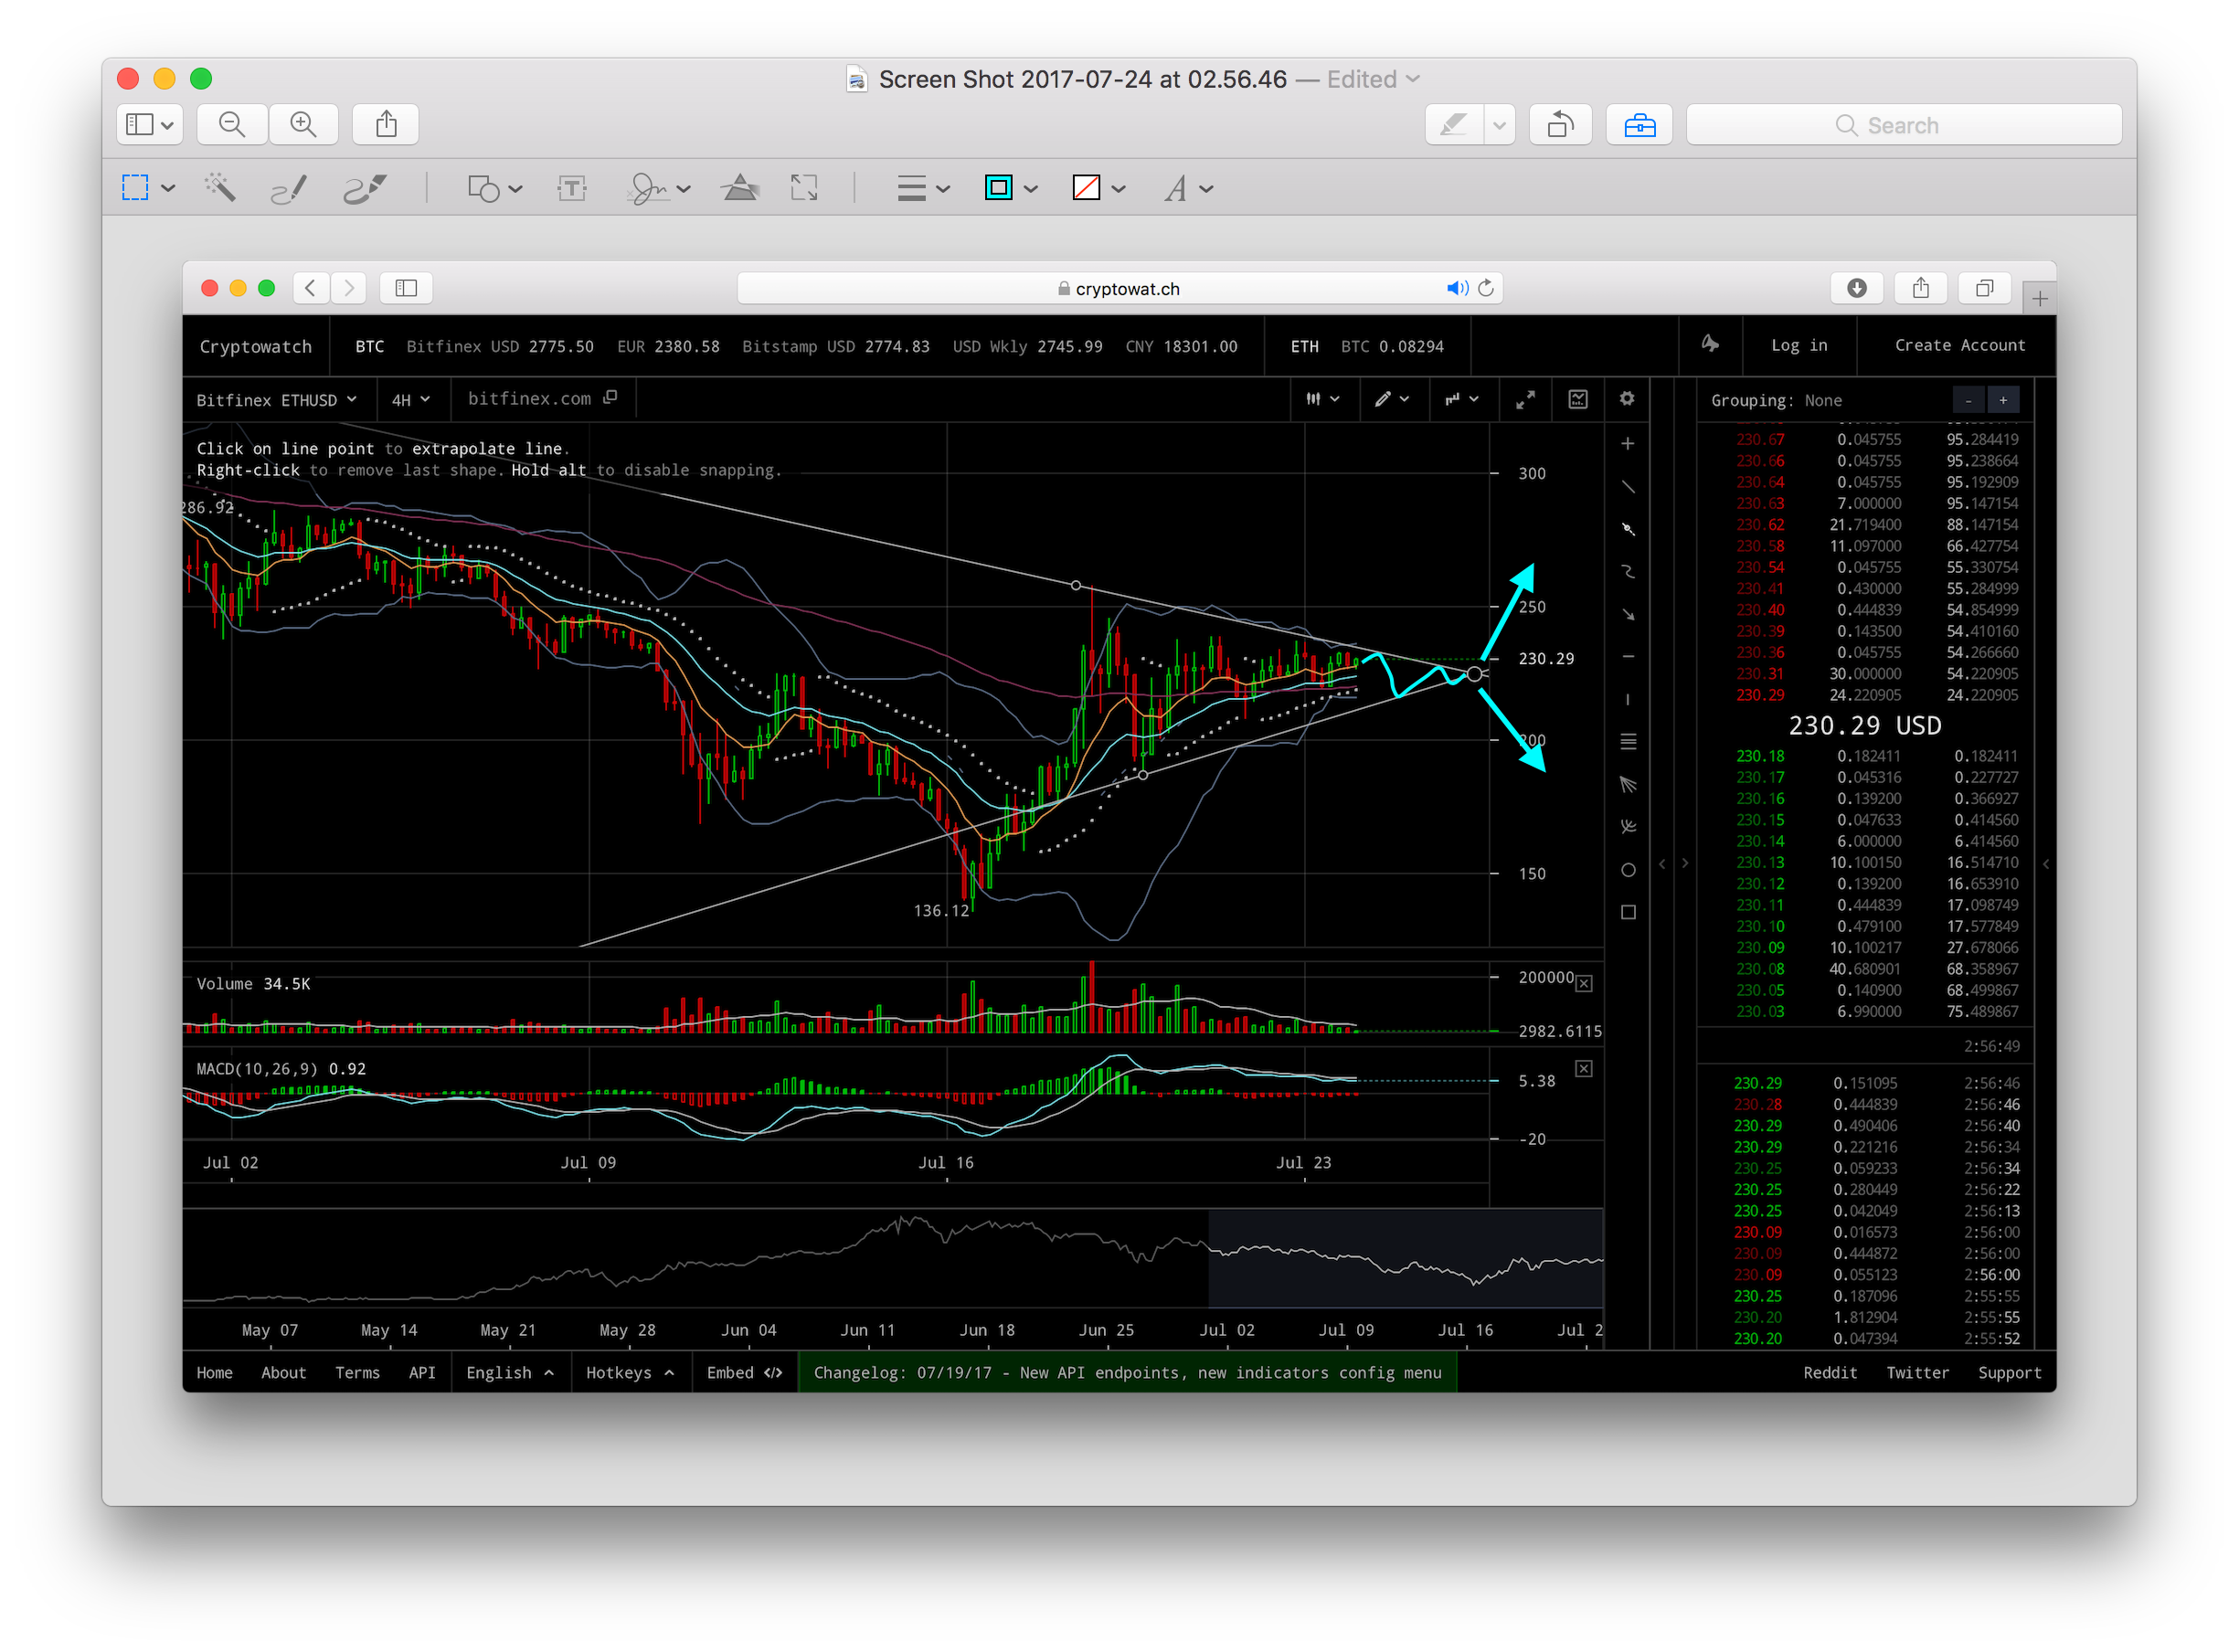
Now - I really don't know what I was thinking (even though I said I chose a random point for the bottom line) -- because the obvious point to choose was at the very bottom of the dip!!!!!
Here's what actually happened in the weeks since - and I've marked what looks to me like the obvious triangle which formed:
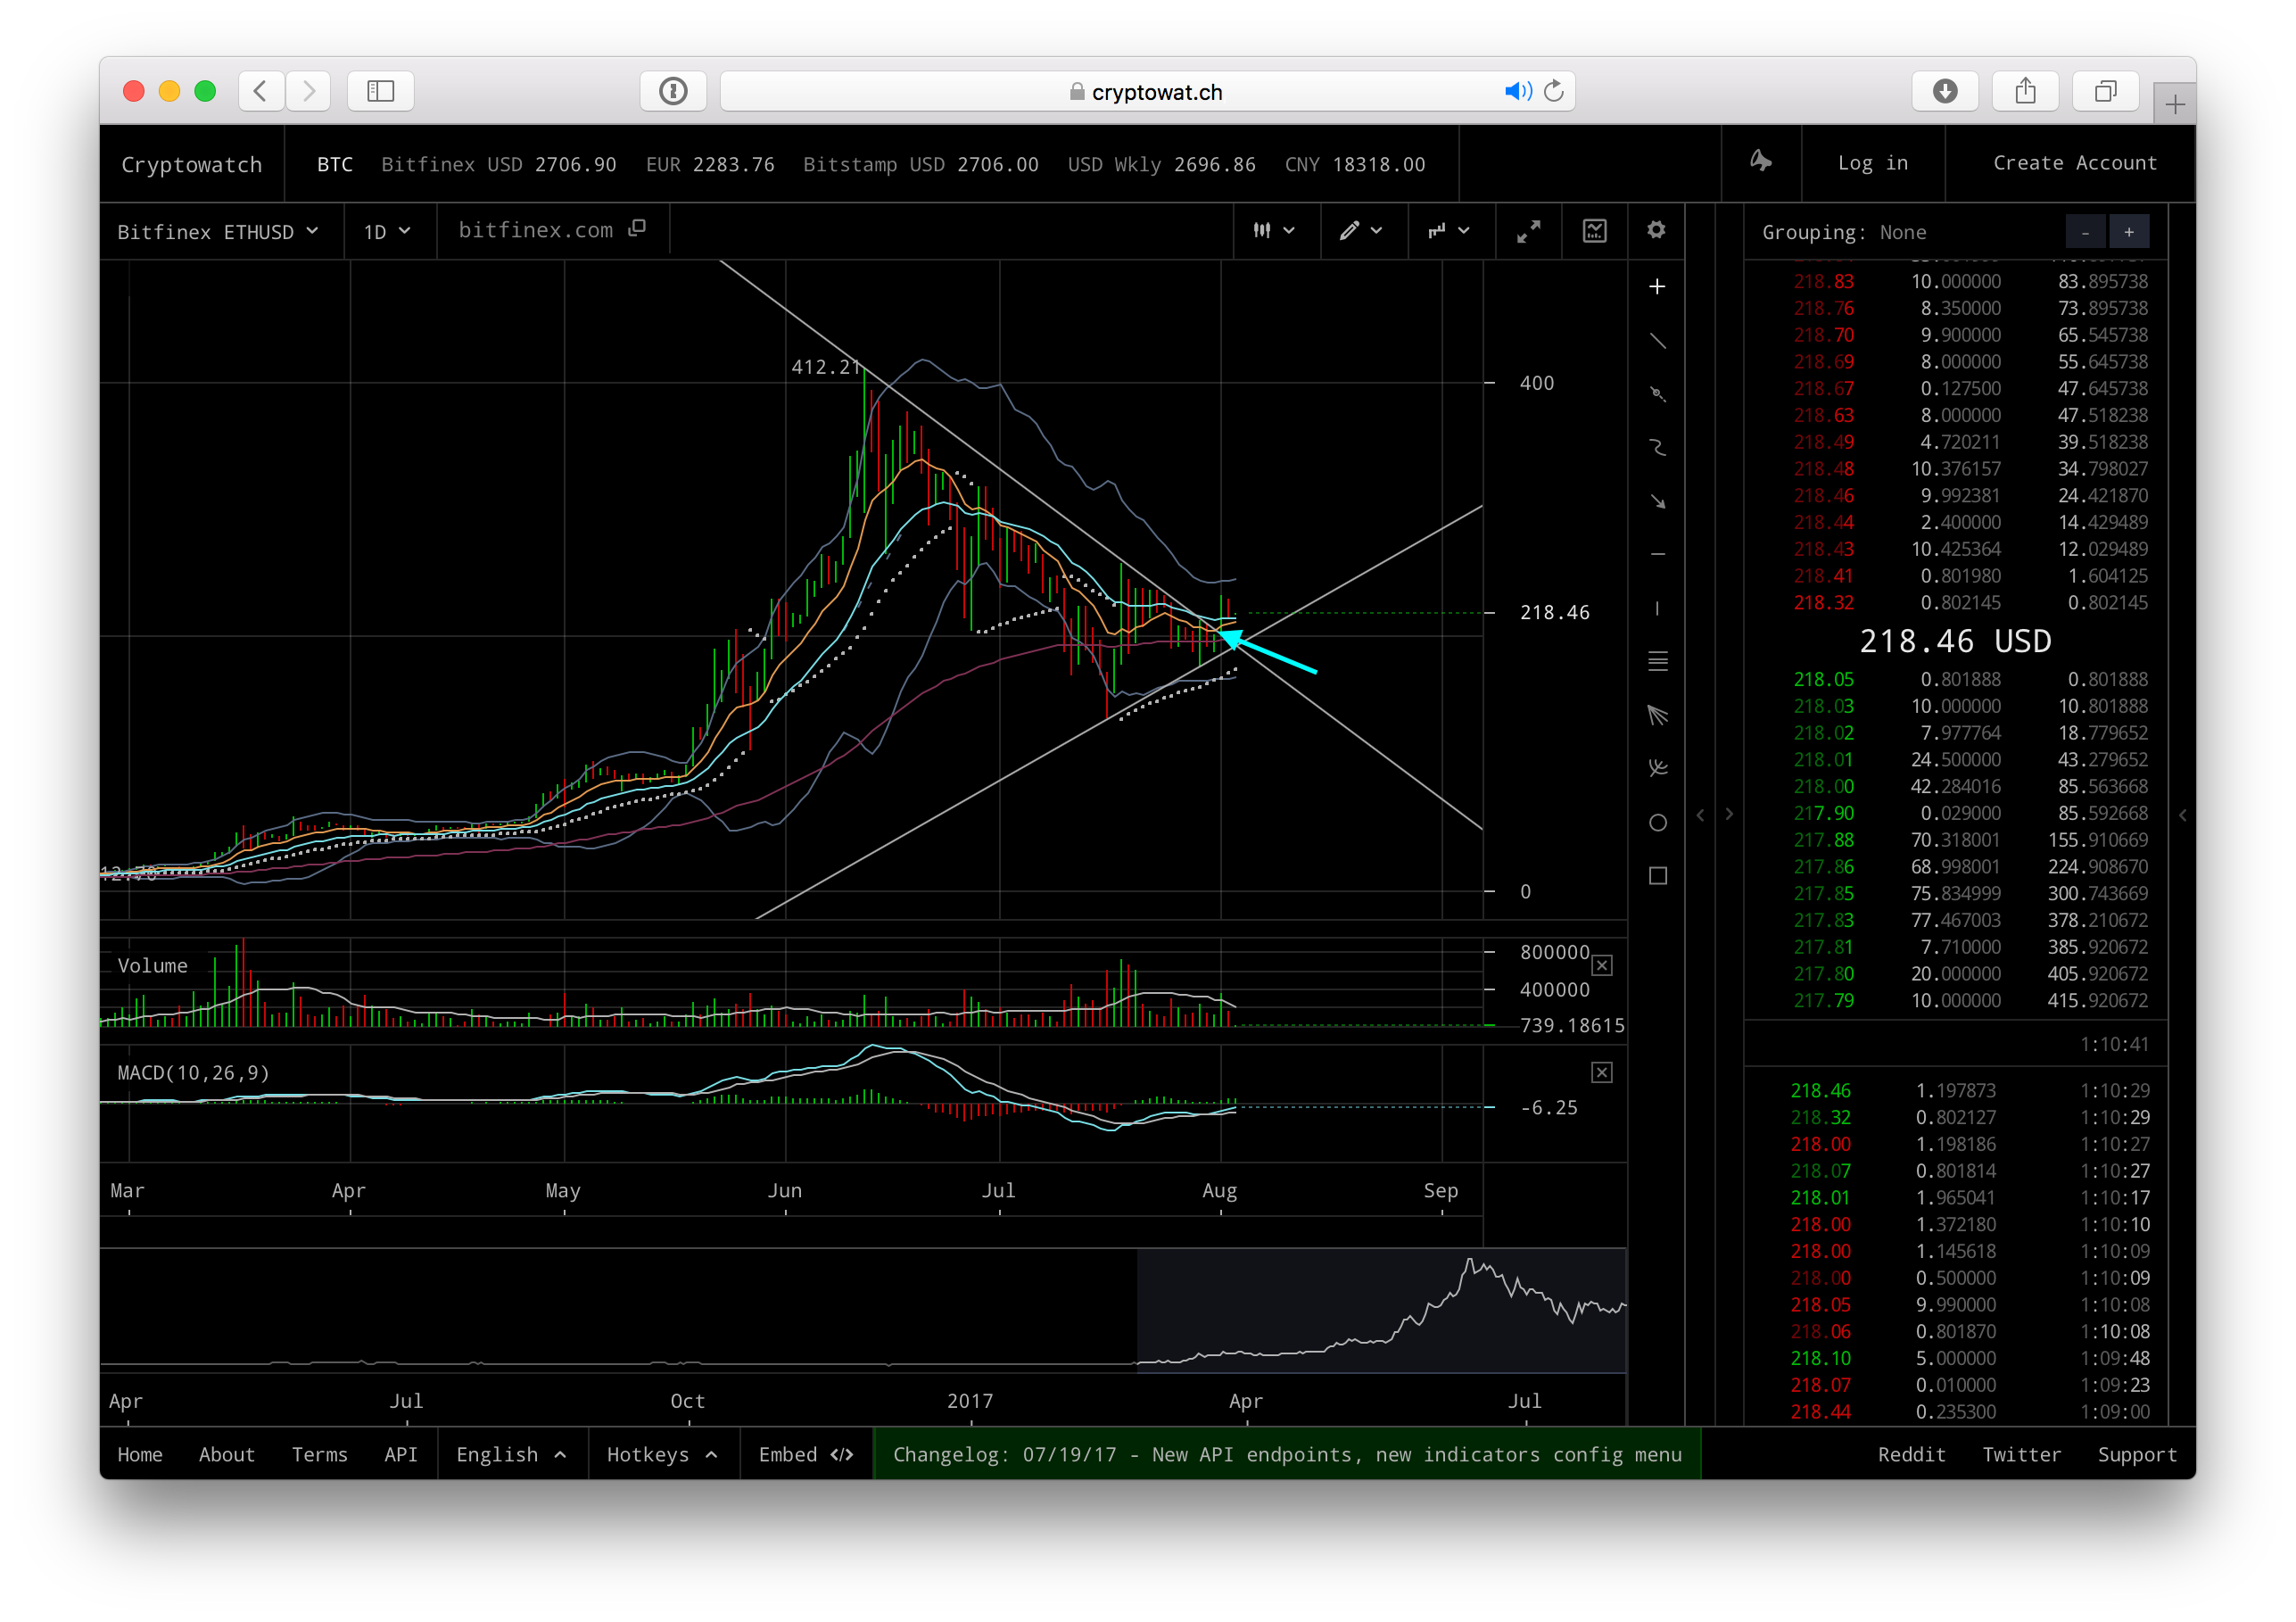
So, a natural trading opportunity would have been to buy when the break-out occurred (I've marked this point with an arrow).
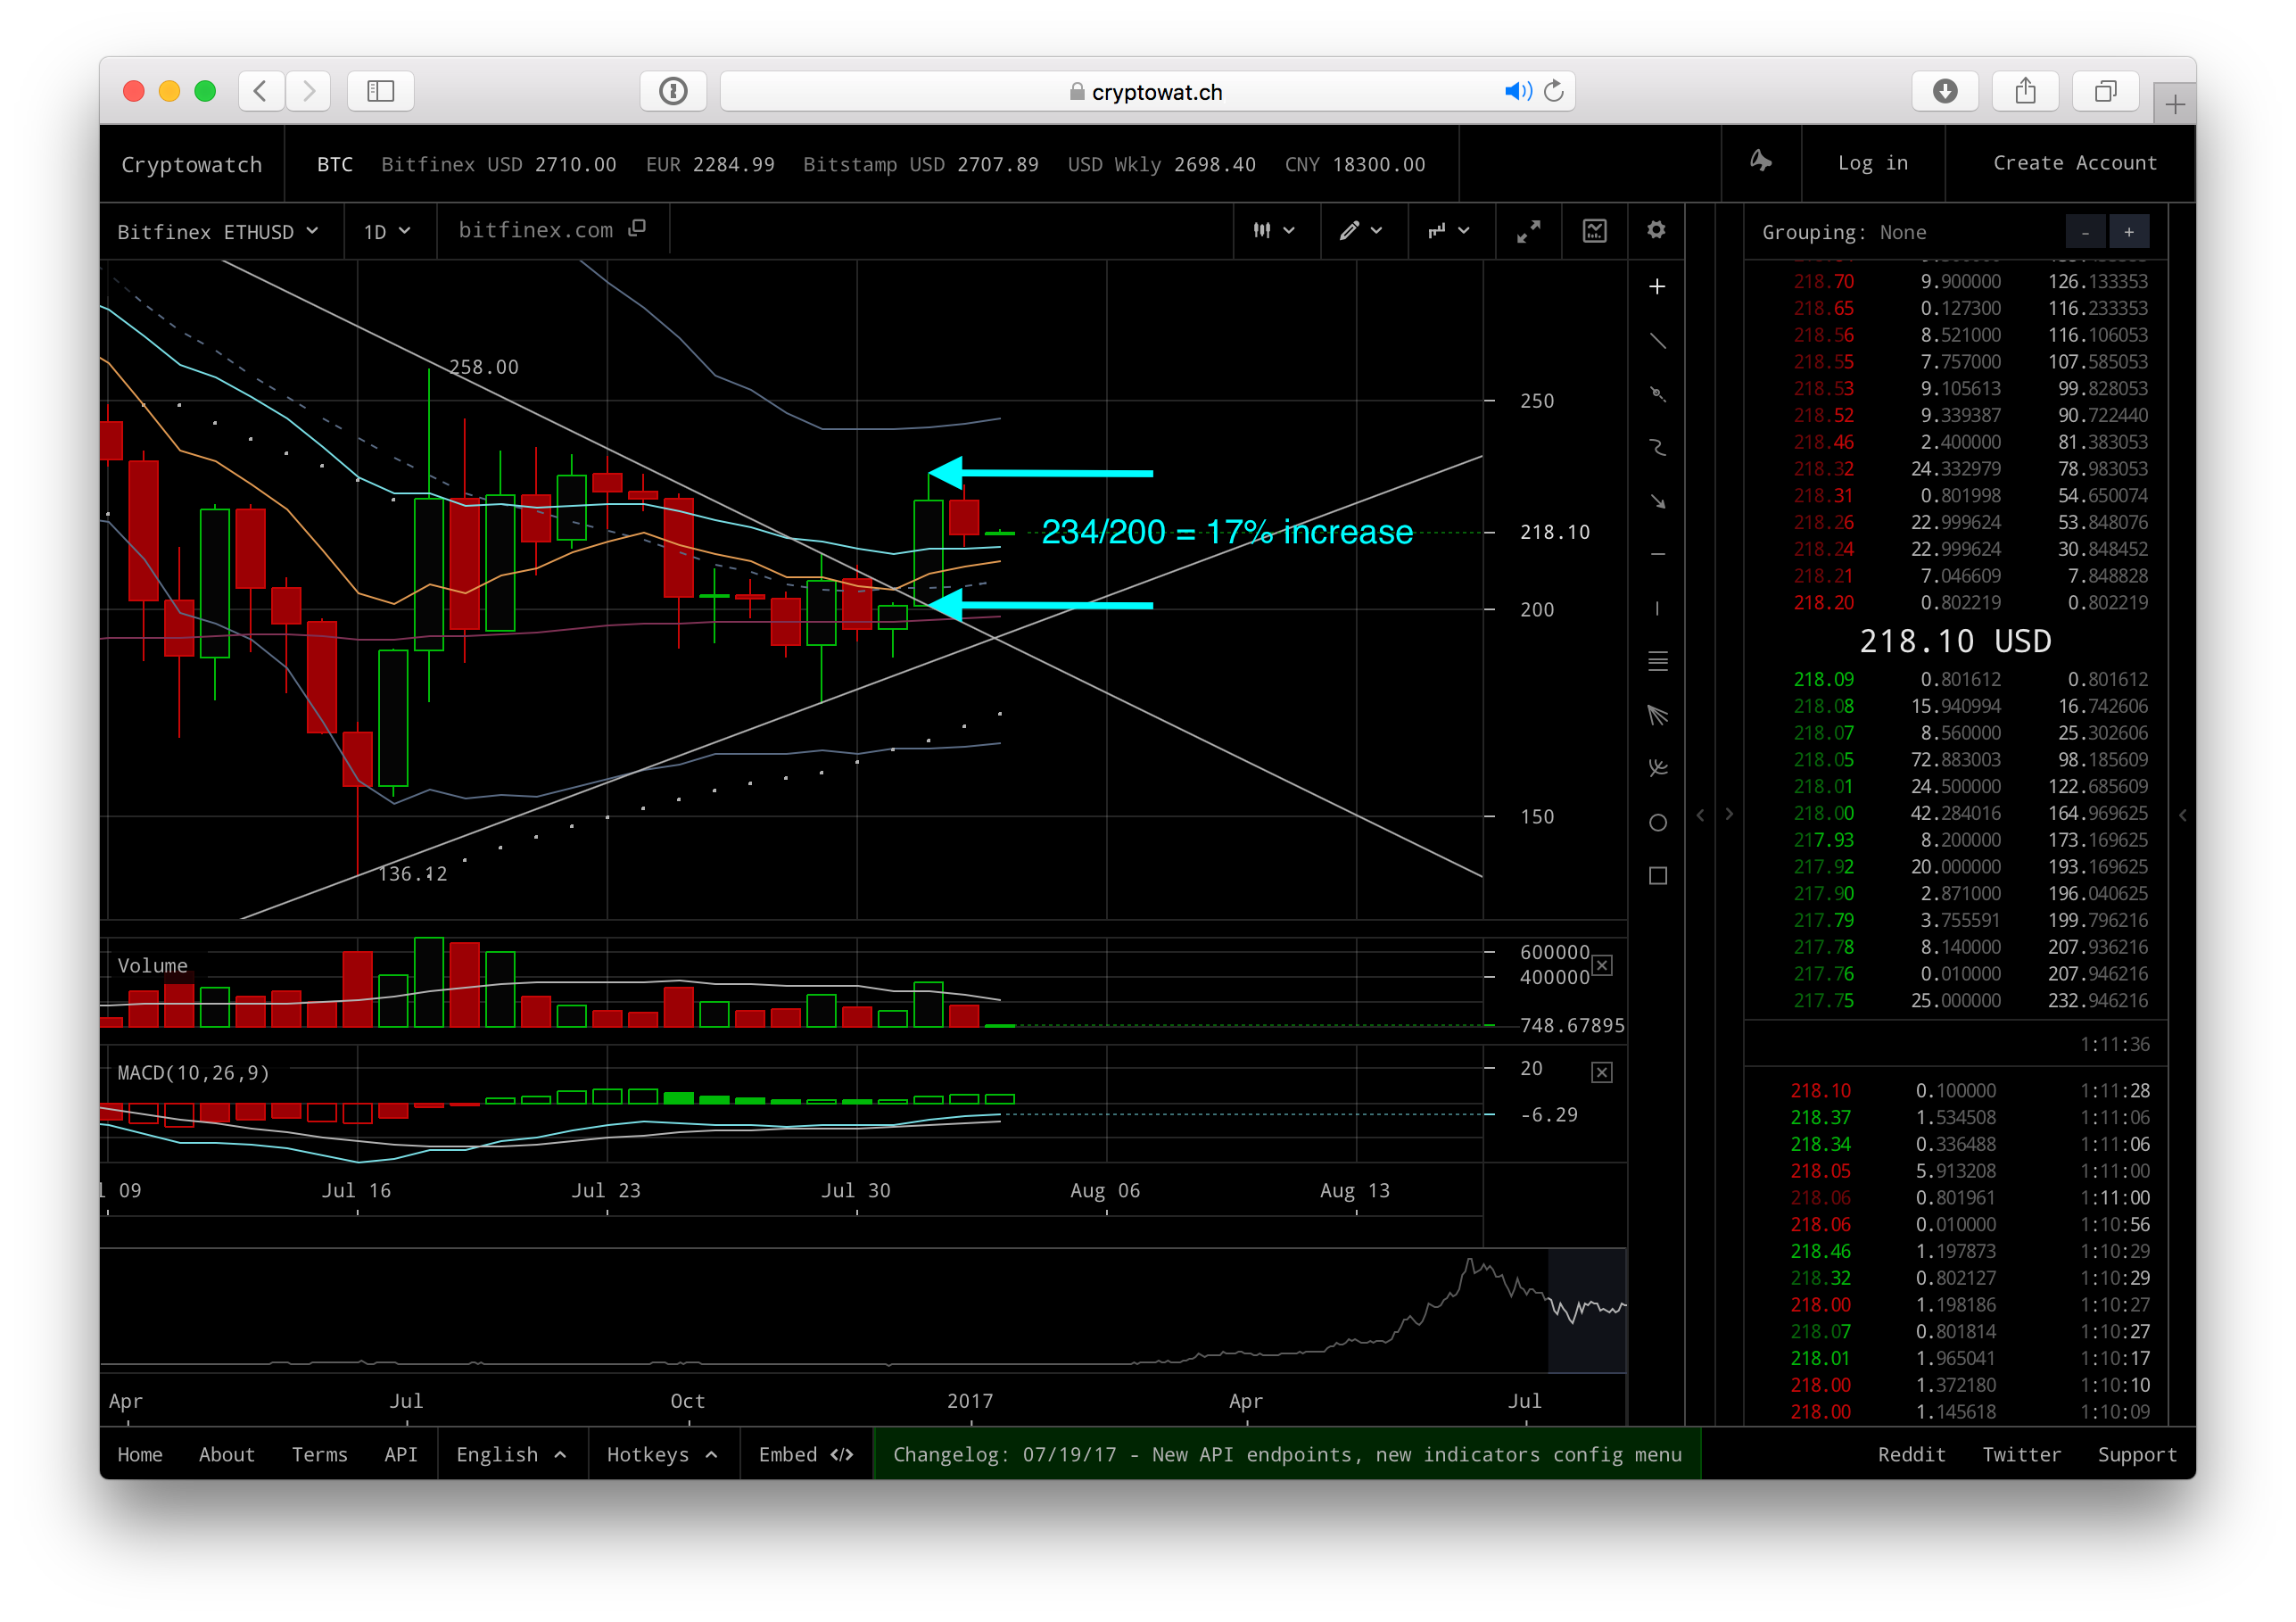
Here's also a zoomed up version, which shows the maximum profit that you could have got (although, of course, it's very difficult to sell right at the top..):
In fact, for me, there were pointers which I saw in the chart which changed my position from being moderately pessimistic about an upward bounce (after we dropped down from $230) - to becoming quite positive by the time the triangle completed:
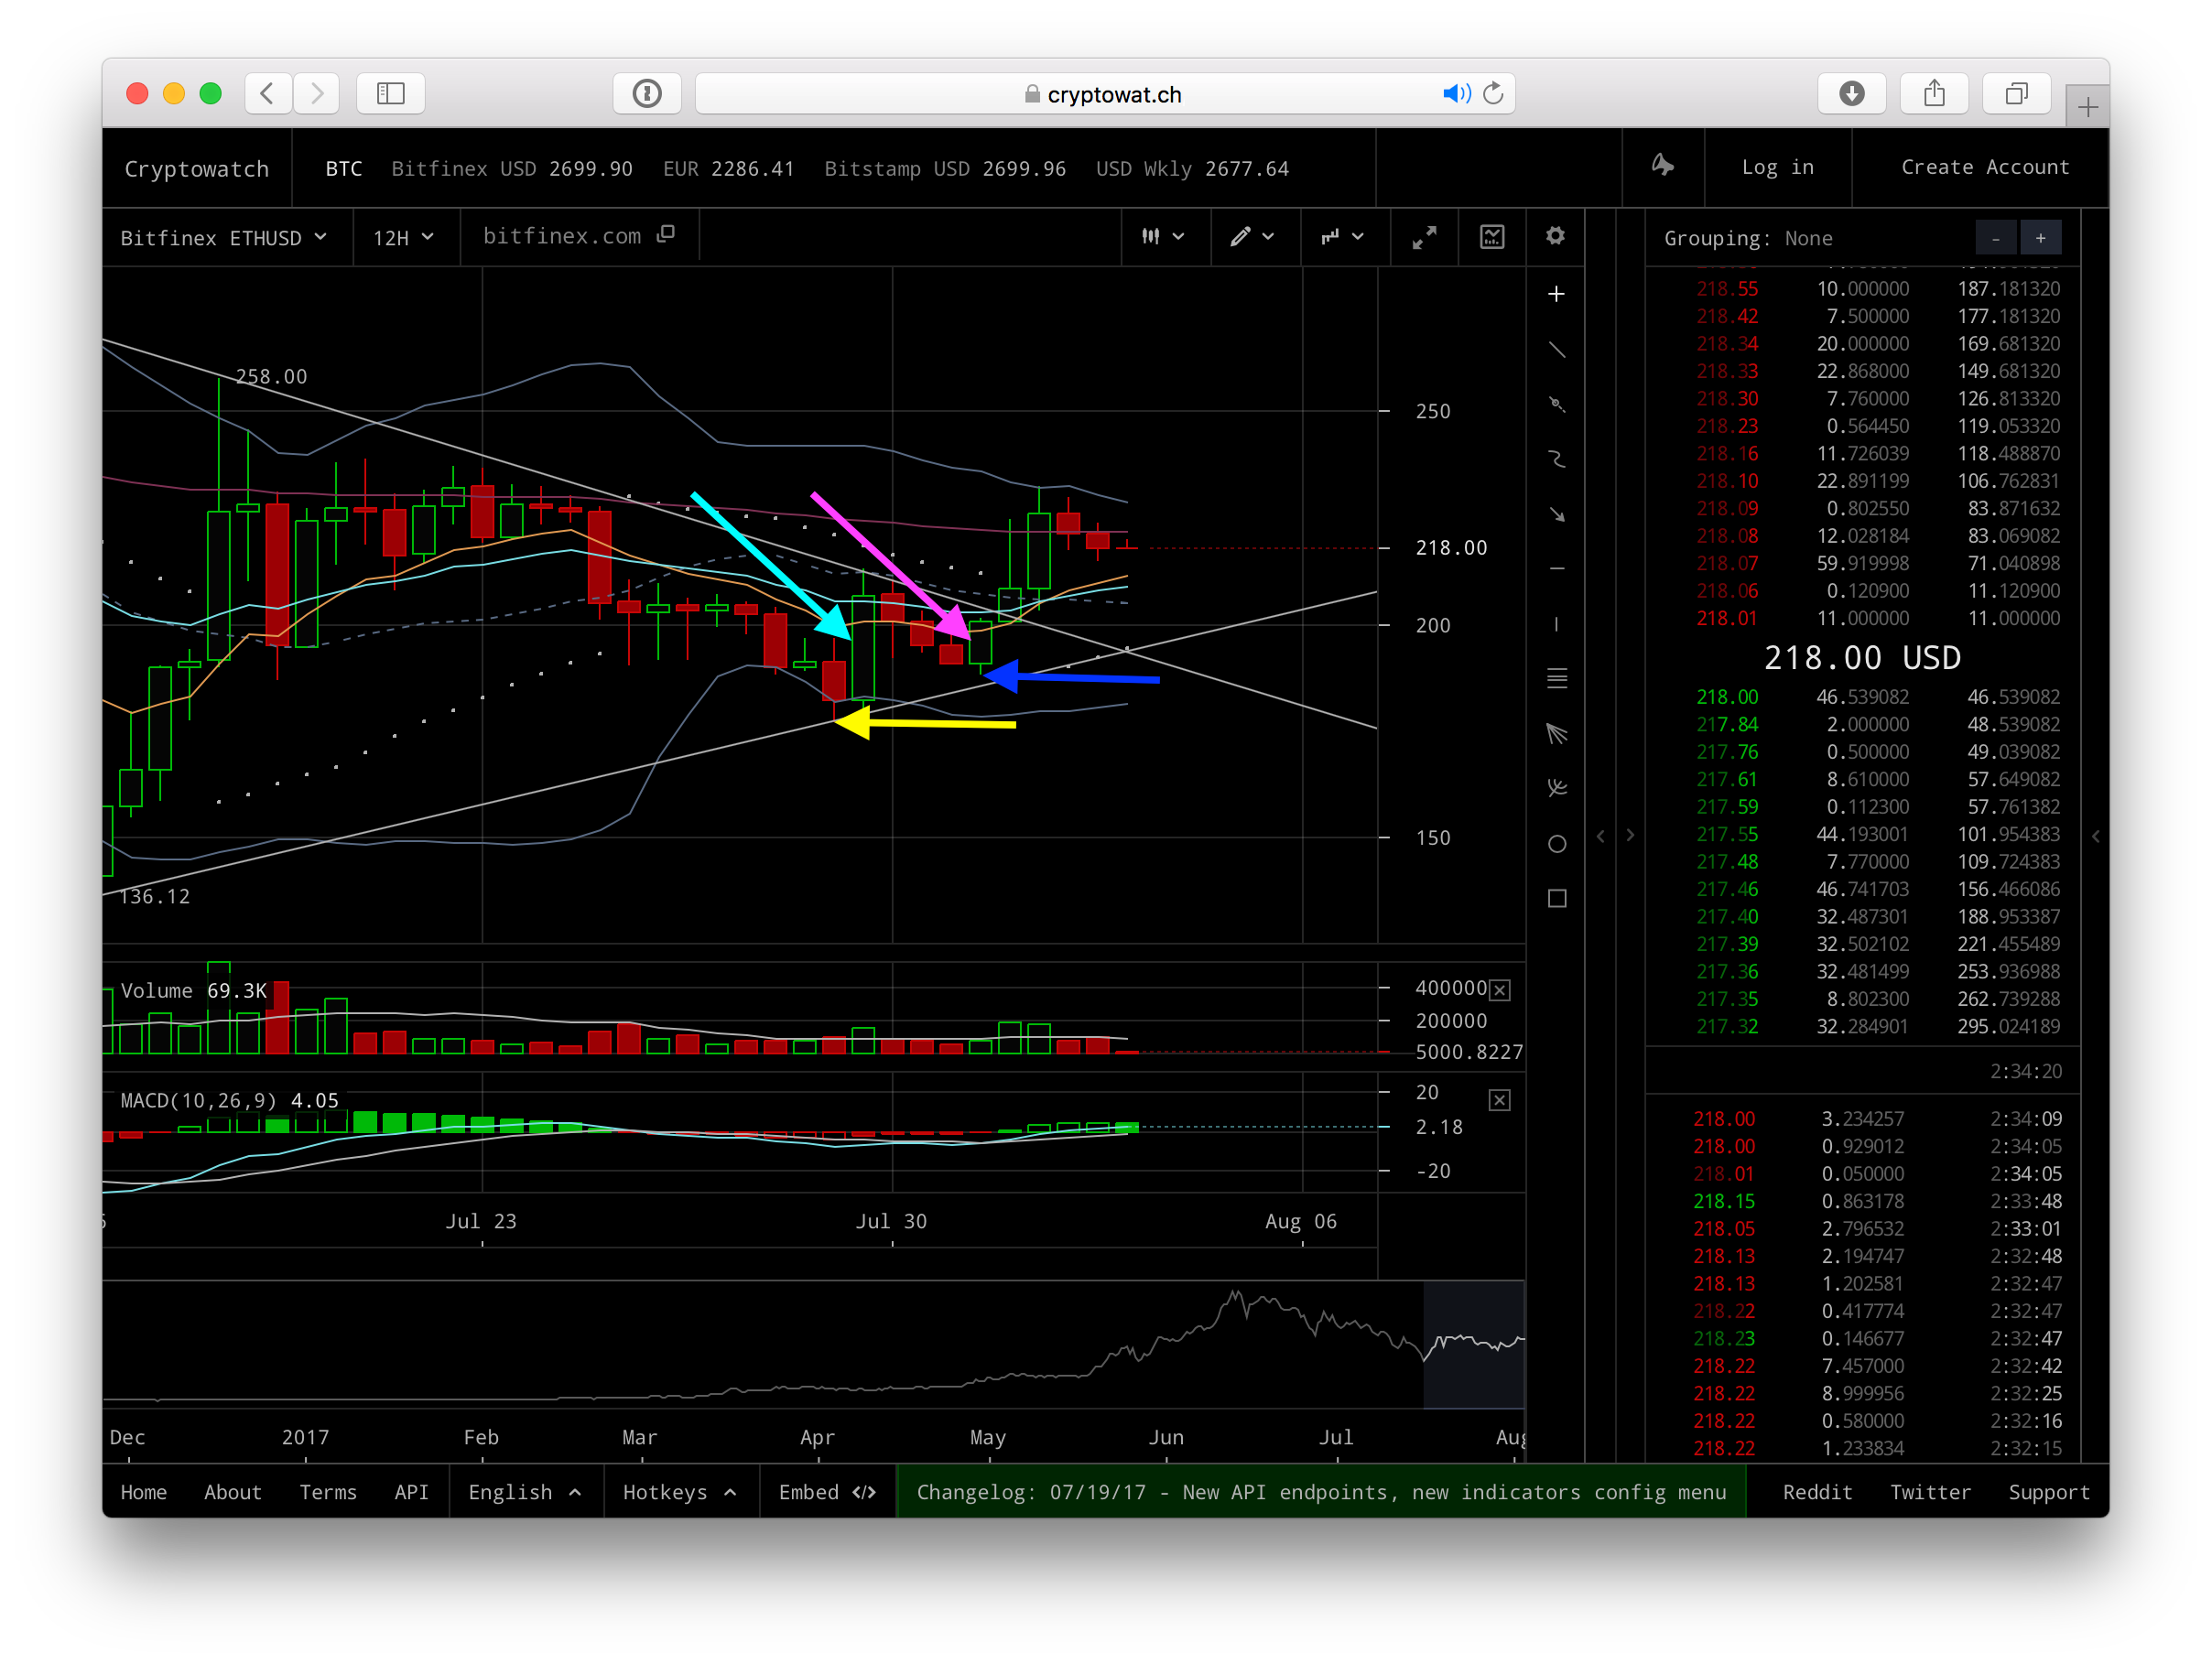
(1) [yellow arrow] This point that we bounced at was pretty much the perfect point to give a just-about a perfect symmetrical triangle, formed by touching both the highest and lowest points of the whole correction period.
(2) [cyan arrow] The green bar rebounded higher than the red bar which preceded it. Very bullish!
(3) [blue arrow] The third low point is higher than the bottom line of our triangle. Very bullish!
(4) [magenta arrow] The green bar on this next low point also (again!) rebounds higher than the red bar which precedes it. Very bullish!
So, personally, I built a position as this triangle was closing due to the above factors - so perhaps my overall buy price-in was around $190. (However, my exiting of the move has so far been the opposite! ;( I was expecting more of a bounce, so didn't sell around the $230 mark, and instead lost quite a bit of the gain by selling low and then re-buying back higher (haha...) - but still in profit (for now!))
Anyway, this retrospective analysis isn't very useful for deciding whether to buy or sell now. I was therefore going to discuss the current charts, but probably I should make a separate post for it. But, with that said, I'm perhaps leaning a bit towards the bullish side right now.
One reason is that on the 1-day chart, the EMA lines are getting very close to each other! In the chart below, I've marked a cyan circle around this:
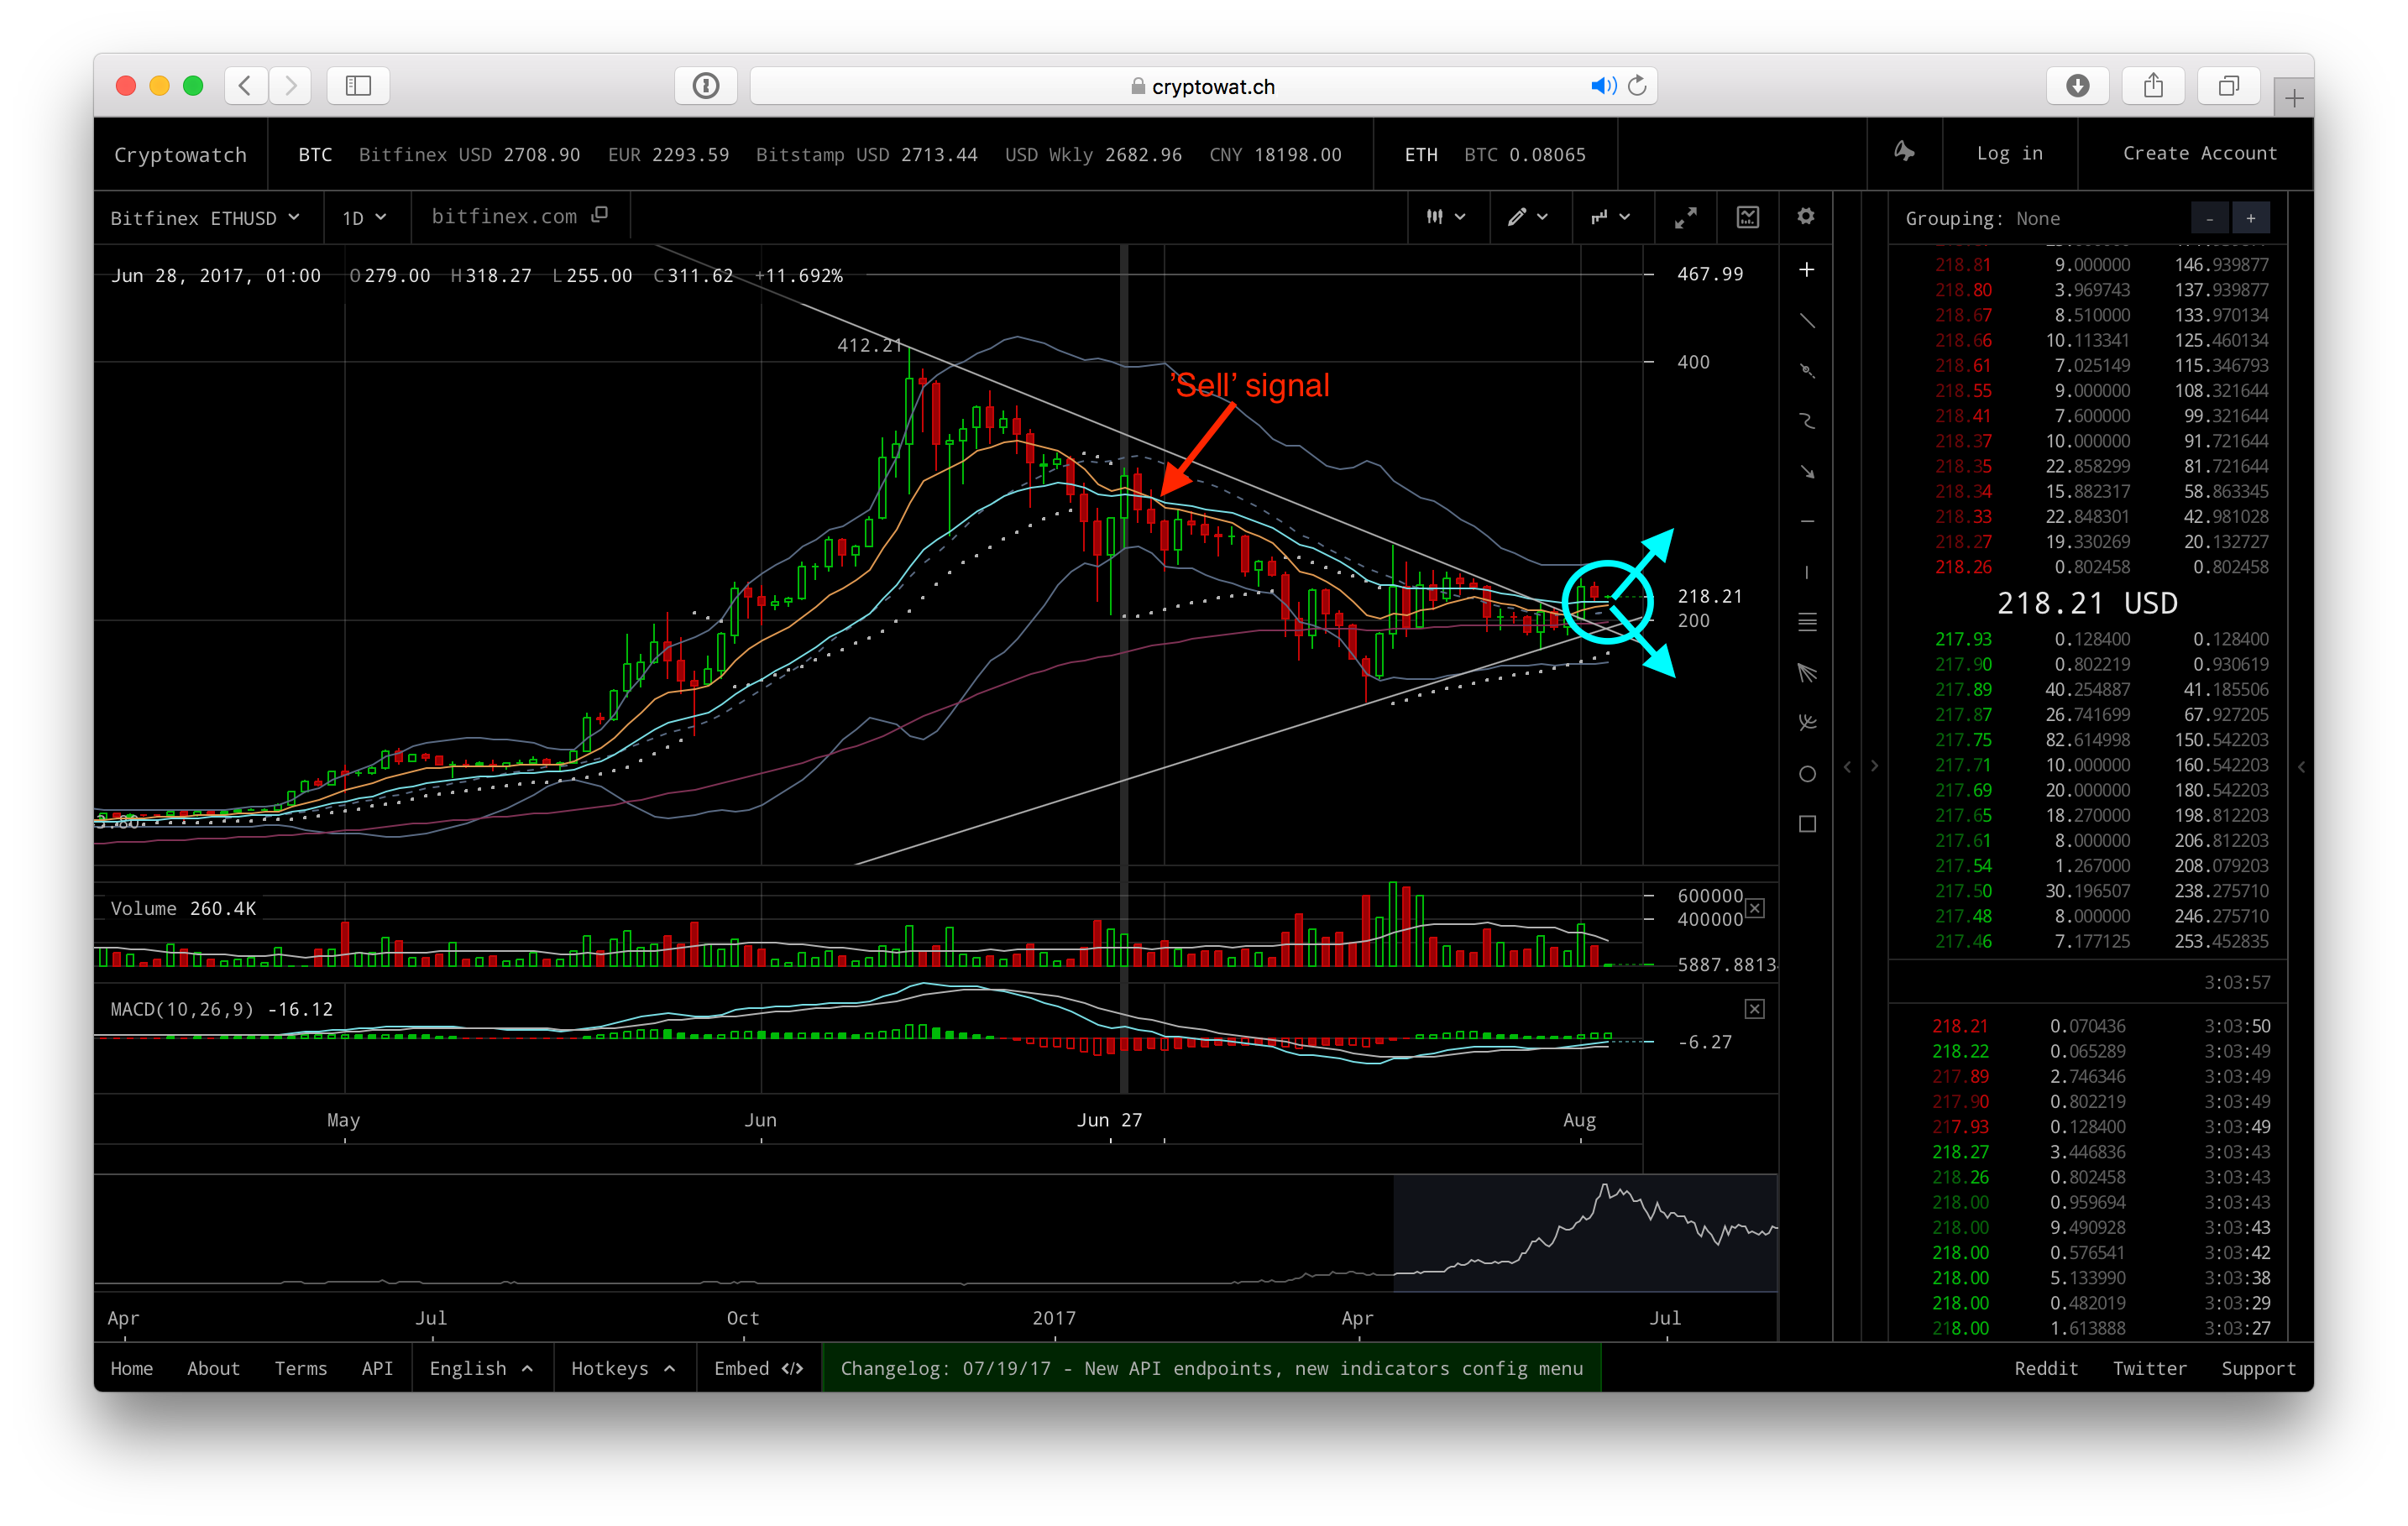
The implication of this is that if the price were to move just a bit more upwards, then these lines might cross and therefore provide a buy signal on this timeframe (and using this method for choosing signals); On the other hand, however, a 'close miss' of a cross-over is very much a strong reason to sell (from my experience). So, it could go either way - but because they are coming close together, a trading opportunity for a break-up or break-down could occur soon (based on this methodology) :-)
But this is not trading advice. Also, since I'm always looking to trade bullish-looking moves (since I don't short-sell), I'm often wrong a lot of the time (e.g., buying in advance of something I think could happen, but doesn't!)
DISCLAIMER: This post does not offer trading advice, and I am not suggesting the reader should buy (or sell) Ethereum. Any trading decisions the reader may make after reading this must be completely at their own responisbility. Any comments I make are simply describing reasons I may make for my own trades, and do not have any non-subjective 'scientific' backing.