This is an analysis of the voting percentages of @utopian-io from inception to present day with a particular focus on the previous weeks' activities.
Sections
Vote numbers - previous 7 days; last 30 days; since first vote cast on the 29th September 2017
Votes against reputation of author
Votes weight against reputation of author.
Analysis and Summary
Tools used to gather data and compile report

General
@utopian-io is the open source project for open source projects, housed on the Steem Blockchain.
Currently, @utopian.io holds 3.7 million Steem power through delegations from its kind sponsors.
To become a sponsor and view the current standings visit https://utopian.io/sponsors
Recent reports of this type are listed here:
1. Vote Counts
The following SQL query has been used to extract this data:
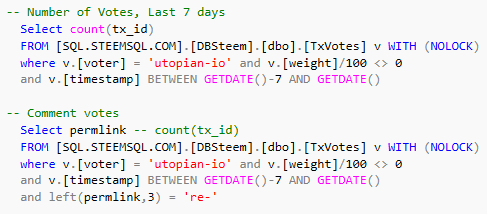
Total number of votes given in the past 7 days: 1492 (867 for the previous week)
Number of votes given in the past 7 days for comments: 0
Daily average: 213 (124 for the previous week)
Total number of votes given in the past 30 days: 4567
Number of votes given in the past 30 days for comments: 9
Daily average: 152
Total number of votes given since 29th September (first vote): 6228
Number of votes given since 29th September for comments: 19
Daily average: 74
As we can see, @utopian-io has increased its daily number of votes over the past two and a half months as the number of contributions continues to rise each week.
The 7 day average vote count has rose dramatically in the past week with 625 more votes being cast than the previous week. A rise of 72%!
This is a huge increase of votes in a single week, and it is therefore likely that the vote weight percentages assigned to each category have been dropped accordingly.
2. Votes and Reputation
The vote count is on the vertical axis, and the reputation range on the horizontal axis.
Votes across Reputation over the past 7 days
To extract this data, the following SQL query has been used:
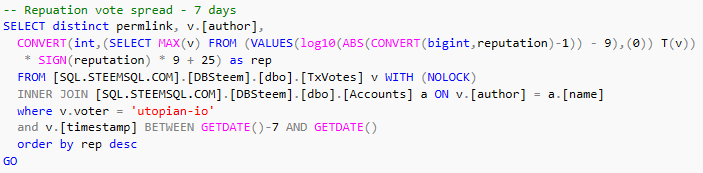
Note the calculation to refine the user reputation, and the joining of the 'Accounts' table and 'TxVotes' table.
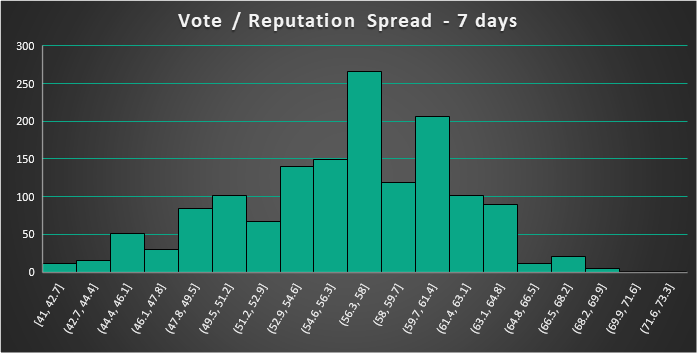
The average reputation here is 56.3 (57.9 last week)
Votes across Reputation over the past 30 days
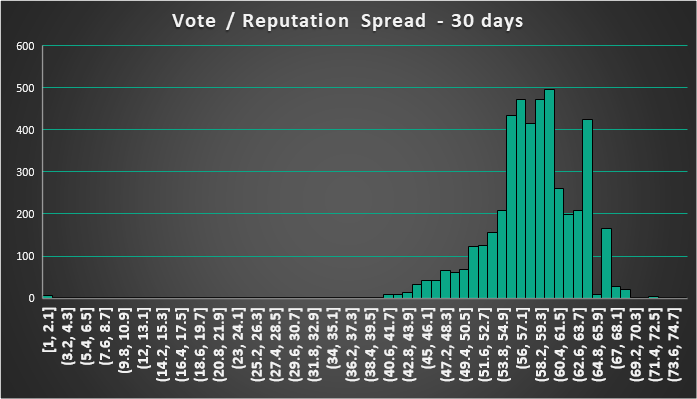
The average reputation here is 58.0
Votes across Reputation since 29th September (first vote)
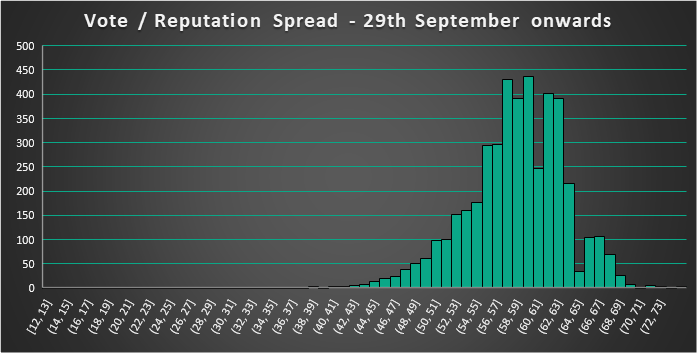
The average reputation here is 58.4 (58.8 previously)
In the previous weeks analysis, we saw the reputation of utopian-io contributors rising and last week i wrote:
It's interesting to see the average reputation of contribution account still in the 50's, but is steadily increasing as time goes on.
We have seen a huge increase in contributions this past week, and looking at the numbers here it seems that many of these contributions have been submitted by newer accounts.
3. Vote Weight and Reputation
The vote weight is on the vertical axis, and the reputation range on the horizontal axis.
This past week, a 100% vote was awarded by accident - this vote has been removed from the charts and analysis below.
Weight (Strength) of votes cast across reputation over the past 7 days
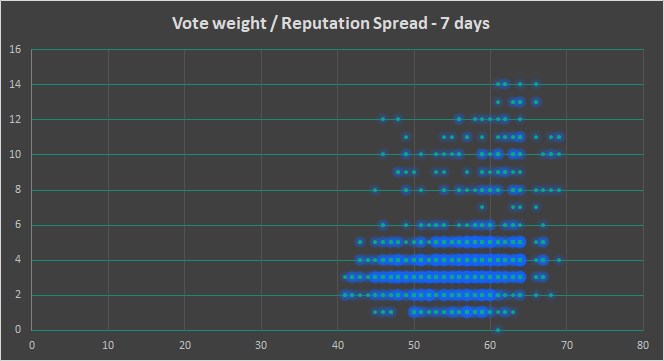
A beautiful representation of the vote weight percentages along with the contributor reputation score!
We can see that the most popular weight of vote over the past week has been in the range of 1 - 5%, and that the most common contributor reputation is in the 45-65 range.
Weight (Strength) of votes cast across Reputation over the past 30 days
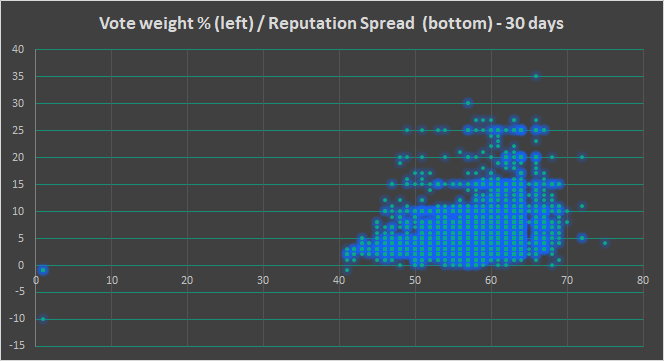
In the 30 day chart, we can see some of the votes in the past of 20% and above, including a single vote at 35% for a user with reputation 66.
Also in the 30 day chart, their are votes for reputation 70 and above which are not present in the 7 day graph.
Weight (Strength) of votes cast across Reputation since 29th September (first vote)
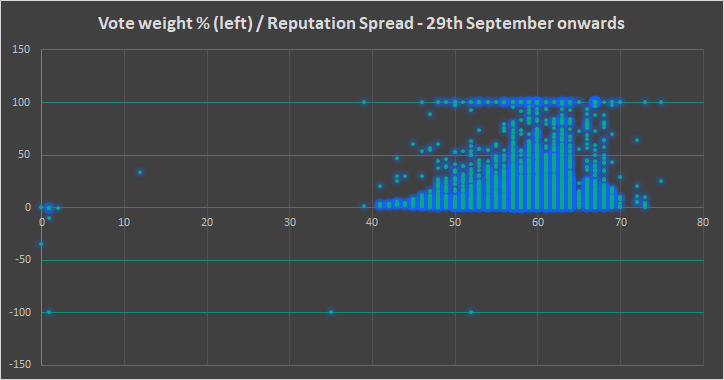
This chart, with data from project inception date, provides a look back at how popular 100% votes were from utopian-io in the first month or so of the project.
4. Analysis and Summary
The number of average daily votes has risen dramatically over the past 7 days. This has had a knock on effect to the weight of vote given by @utopian-io for the contributions made. The positive side is that the price of Steem has risen impressively over the past week also, almost negating a the drop in vote weight.
The average reputation of post owner voted on is 58.4 across the lifetime of voting but averages at 56.3 in the past week. This shows a continuing trend from the last analysis of the data, whereby there is a constant influx of new authors for @utopian-io, who are looking to contribute and build their reputation here.
Vote weight has sensibly be adjusted in line with the increasing amount of contributions submitted and has had good fortune perhaps with the rising price of Steem.
The most popular vote weight percentages this past week are 1,2,3,4, and 5%. Last week I reported the most popular %'s as being 5, 8, 10, and 15%.
The maximum vote weight in the past 7 days was 14%, down from 20% last week.
4 contributors received the maximum vote given this week.
This is the first week since the inception of the project, that the vote weight has not surpassed 15%.
Overall, I think @utopian-io are using their Steem Power delegation appropriately, and for many weeks I have suggested that vote weight must fall in line with the increasing number of contributions.
The real bonus at present has been the rise in the price of Steem. The reductions of 50 - 75% in vote weight for all categories has been 'hidden' by this so far. A fall in the price of STEEM could see a different picture being painted in the coming months - lets hope that is not the case.
At this point in time though, the future is looking bright for this project.
5. Tools used to gather this report
The data is sourced from SteemSQL - A publicly available SQL database with all the blockchain data held with (Data is normally 1/2 hours delayed from live)
The SQL queries to extra to the data have been produced in both SQL Server Personal Edition and LINQPAD 5.
The charts used to present the data were produced using MS Excel.
This data was compiled on the 19th December 2017 at 12:30pm CET
Thanks
Asher @abh12345
Posted on Utopian.io - Rewarding Open Source Contributors