This is a look at the most popular tags used within each contribution category.
Sections
Category contribution totals
The Ten most popular tags in each contribution category
Summary
Tools used to gather data and compile report

1. Category contribution totals
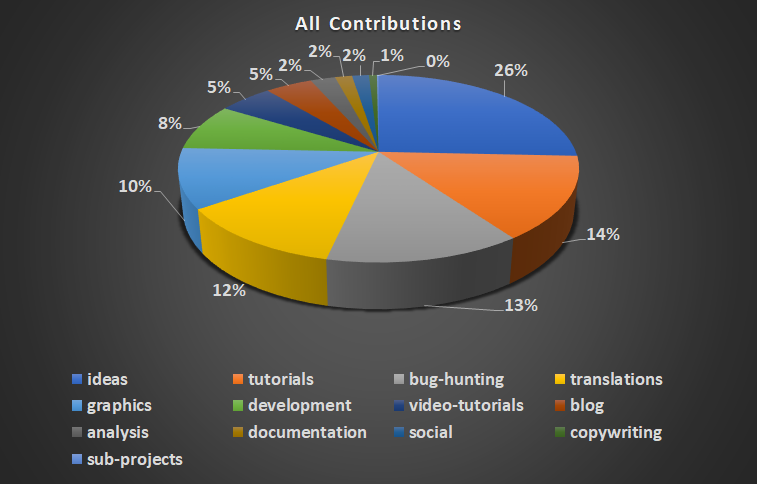
From the inception of utopian-io we have seen 4709 contributions across the 13 main contribution types. These types are listed below and displayed as a pie chart.
| Contribution Type | Total |
|---|---|
| ideas | 1209 |
| tutorials | 680 |
| bug-hunting | 630 |
| translations | 557 |
| graphics | 485 |
| development | 382 |
| video-tutorials | 246 |
| blog | 212 |
| analysis | 112 |
| documentation | 77 |
| social | 76 |
| copywriting | 36 |
| sub-projects | 7 |

As we know, each contribution is allowed 4 tags, as the first tag is reserved for 'utopian-io'.
The purpose of this report is to detail which are the most popular 'additional' tags used for each contribution category, and this is displayed in the next section.
2. The Ten most popular tags in each contribution category
The tables are ordered in contribution type order - (Tag, Total number of Tags)
Analysis
| Tag | Total |
|---|---|
| analysis | 72 |
| bisteemit | 71 |
| data | 37 |
| contribution | 31 |
| steemit | 31 |
| steem | 19 |
| analytics | 9 |
| stats | 7 |
| sndbox | 6 |
| contributors | 5 |
Blog
| Tag | Total |
|---|---|
| blog | 49 |
| steemit | 40 |
| utopian-io | 38 |
| opensource | 26 |
| steem | 23 |
| utopian | 17 |
| spanish | 16 |
| indonesia | 13 |
| open-source | 10 |
| community | 9 |
Bug-hunting
| Tag | Total |
|---|---|
| bug | 319 |
| steemit | 150 |
| utopian-io | 102 |
| busy | 100 |
| opensource | 73 |
| esteem | 57 |
| airhawk-project | 50 |
| steem | 48 |
| bugs | 44 |
| testing | 39 |
Copywriting
| Tag | Total |
|---|---|
| copywriting | 14 |
| utopian | 12 |
| utopian-io | 8 |
| utopian-help | 5 |
| blog | 3 |
| steem | 3 |
| business | 2 |
| marketing | 2 |
| rules | 2 |
| sndbox | 2 |
Development
| Tag | Total |
|---|---|
| steemdev | 123 |
| programming | 102 |
| opensource | 76 |
| steem | 43 |
| steemit | 35 |
| busy | 29 |
| dev | 29 |
| development | 22 |
| utopian-io | 22 |
| condenser | 21 |
Documentation
| Tag | Total |
|---|---|
| steemdev | 16 |
| steemit | 16 |
| indonesia | 14 |
| utopian-io | 14 |
| documentation | 9 |
| programming | 8 |
| opensource | 7 |
| utopian | 7 |
| busy | 6 |
| github | 4 |
Graphics
| Tag | Total |
|---|---|
| design | 304 |
| graphics | 155 |
| opensource | 142 |
| utopian-io | 140 |
| art | 119 |
| utopiangif | 115 |
| logo | 70 |
| creative | 62 |
| contest | 41 |
| steemit | 35 |
Ideas
| Tag | Total |
|---|---|
| steemit | 487 |
| utopian-io | 278 |
| suggestion | 194 |
| idea | 171 |
| steem | 154 |
| opensource | 145 |
| nigeria | 143 |
| steemdev | 107 |
| ideas | 88 |
| indonesia | 85 |
Social
| Tag | Total |
|---|---|
| steemit | 29 |
| utopian-io | 20 |
| promo-steem | 17 |
| opensource | 14 |
| 11 | |
| visibility | 11 |
| marketing | 10 |
| nigeria | 10 |
| steemdev | 7 |
| busy | 6 |
Sub-projects
| Tag | Total |
|---|---|
| programming | 1 |
| opensource | 1 |
| java | 1 |
| gaming | 1 |
| games | 1 |
| game | 1 |
| contest | 1 |
| condenser | 1 |
| busy | 1 |
| blog | 1 |
Translations
| Tag | Total |
|---|---|
| translation | 373 |
| utopian-io | 172 |
| opensource | 120 |
| blog | 84 |
| contribution | 80 |
| indonesia | 58 |
| busy | 56 |
| cn | 46 |
| steemit | 45 |
| utopian | 43 |
Tutorials
| Tag | Total |
|---|---|
| tutorial | 340 |
| tr | 157 |
| utopian-io | 127 |
| tutorials | 96 |
| indonesia | 82 |
| steemit | 80 |
| wordpress | 67 |
| opensource | 62 |
| howto | 46 |
| contribution | 40 |
Video-tutorials
| Tag | Total |
|---|---|
| tutorial | 138 |
| tr | 83 |
| utopian-io | 67 |
| video | 21 |
| opensource | 20 |
| videotutorial | 20 |
| wordpress | 16 |
| steemit | 13 |
| blog | 12 |
| kodi | 12 |
3. Summary
The most popular tag is 'steemit' which appears as the top tag for 'Ideas' and 'Social'.
We can see that 'utopian-io' is being added as an additional tag, which is not required. (Small development task?)
66 'wordpress' tags for Tutorials.
'indonesia' heads 'china' in the Translations category.
Finally I'm very happy to see 'bisteemit' just one behind 'analysis' in the 'Analysis' category.
4. Tools used to gather this report
The data is sourced from SteemSQL - A publicly available SQL database with all the blockchain data held with (Data is normally 1/2 hours delayed from live)
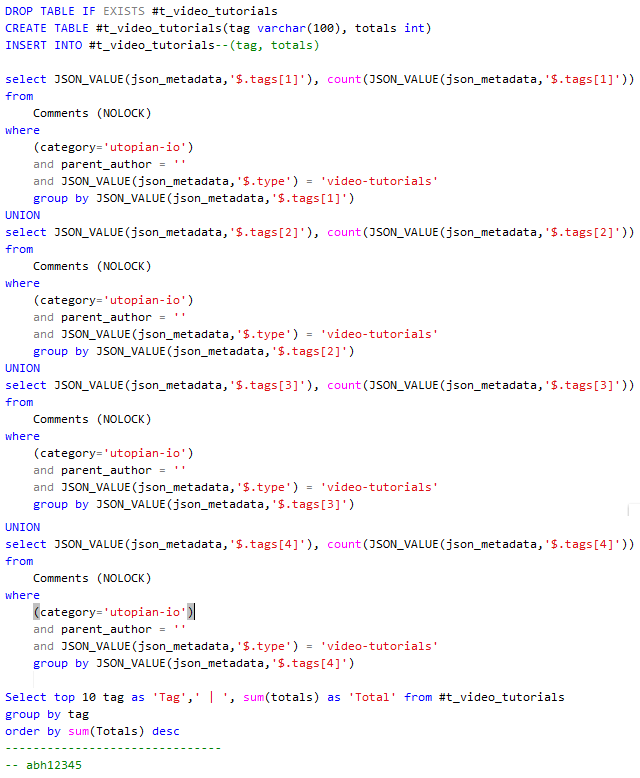
The SQL queries to extra to the data have been produced in both SQL Server Personal Edition and LINQPAD 5.
An extract of code for 1 category type:

The charts used to present the data were produced using MS Excel.
This data was compiled on the 4th December 2017 at 8:30 pm CET
Thanks
Asher @abh12345
Posted on Utopian.io - Rewarding Open Source Contributors
