This study is inspired by a comment I saw on an article last week. The commenter noted that the Steem price had risen rapidly over January but, rather than benefitting from the rise, they felt that their author payouts had not increased. The question thus arises:
Do earnings increase for individual authors when the Steem price rises, or not?
Whilst the answer may at first glance appear obvious, there are in fact drivers that act in both directions on an individual’s payouts when the Steem price rises:
- The amount of Steem paid into the reward pool each day is constant. So the Steem price rising does increase the total overall payouts when considered in USD terms or when expressed in $1 SBD as seen on the Steemit interface.
- The increasing Steem price attracts new authors. The overall payout is diluted as it is spread between a larger number of authors, meaning the amount paid to each author is reduced.
In this study I will look at various metrics to attempt to address this question. I look at the period from 1 October 2017 to 22 January 2018 (the most recent date with completed payouts at the point I started this study). This period takes in significant changes in the Steem price.
0 Summary of Findings and Conclusions
I start by presenting the summary of findings for readers who have limited available time. The full details of the analysis are included in the later sections of this article.
All payouts considered throughout this article are Author payouts only (both articles and comments). The currency is as seen on the Steemit interface, i.e. SBD treated as $1.
0.1 Rising Steem price impact on Total Author Payouts
This first chart illustrates the total Author payouts per day and the Steem closing price in $USD (Steem closing prices obtained from coinmarketcap.com).
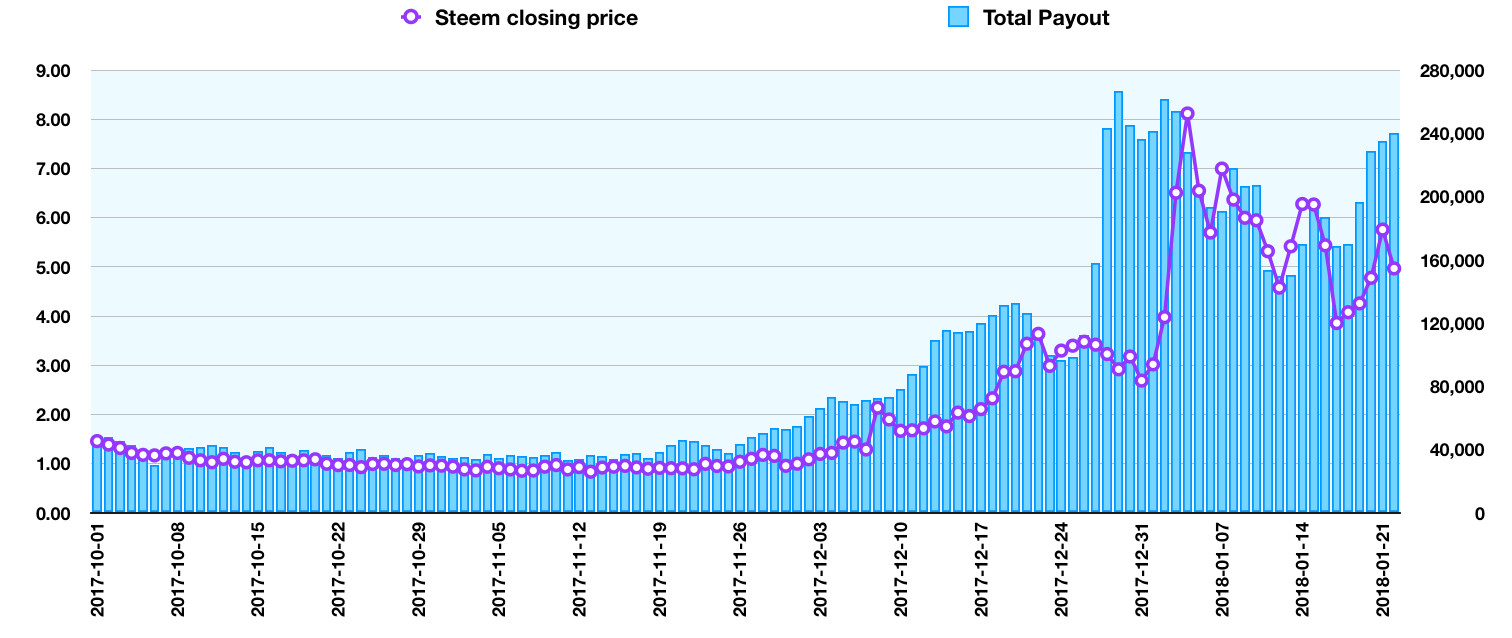
We can see the correlation between the rising Steem price and the rising total payouts. The amount of Steem paid into the reward pool each day is constant. So the Steem price rising does increase the total overall payouts when expressed as $1 SBDs (or when valued in $USD terms).
It appears that the total payouts increase prior to the Steem price rising. However this is simply due to the fact that the total payouts have been grouped by the date on which the comments are created rather than the date on which the payments are made, so there is a seven day lag between the two measures. The reason for this presentation become evident when we look at average payouts below.
0.2 Rising Steem price impact on Daily Author Numbers
This second chart illustrates the total number of daily authors (articles and comments) and the Steem and SBD closing prices in $USD.
(Steem and SBD closing prices obtained from coinmarketcap.com).
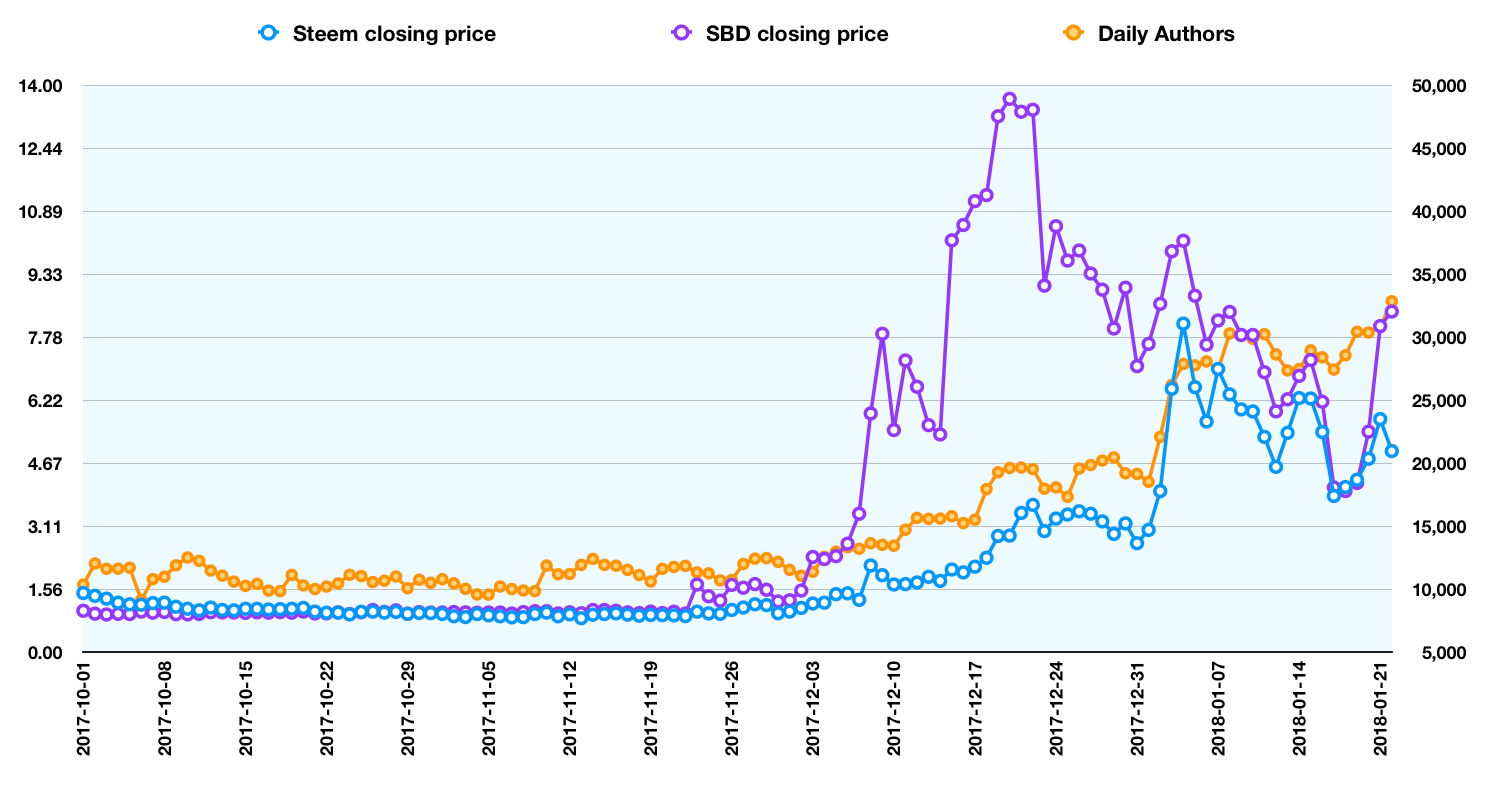
Here we can see the relationship between the rising Steem price and the number of authors publishing articles or comments each day. The rise in authors may be due to new authors arriving on the platform or increasing activity from existing authors (i.e. existing authors post every day rather than once a week). The relationship is clearest at the start of January where the spike in the Steem price is mirrored by a spike in daily authors.
(The relationship between the Steem price and the number of daily authors appears stronger than that between the SBD price and the number of daily authors, at least in December; January is less clear. I have not investigated this question in detail as it is not the topic of this study; I include here only for interest).
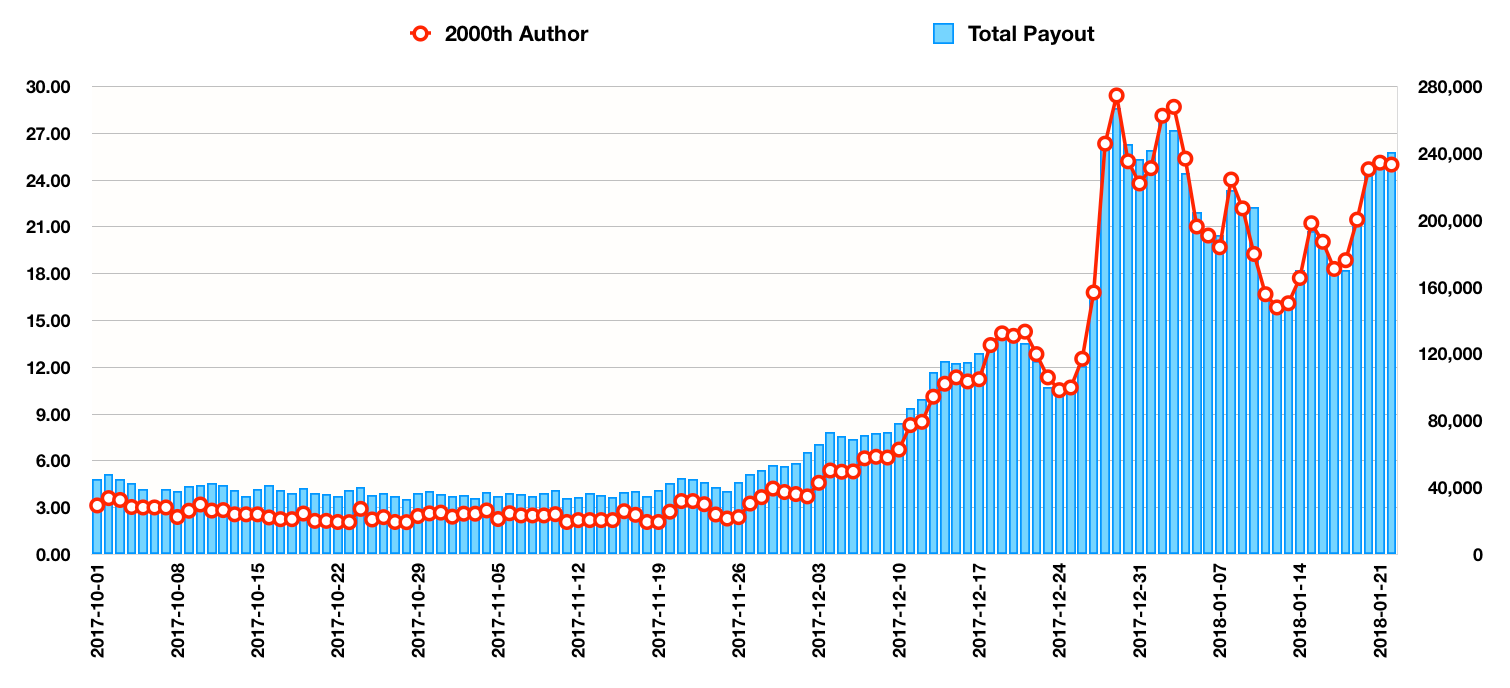
0.3 Comparison of Total Payouts and Average Author Earnings
Combining the information from the two studies above we can now look at the average author earnings per day (i.e. total payout per day / number of daily authors).
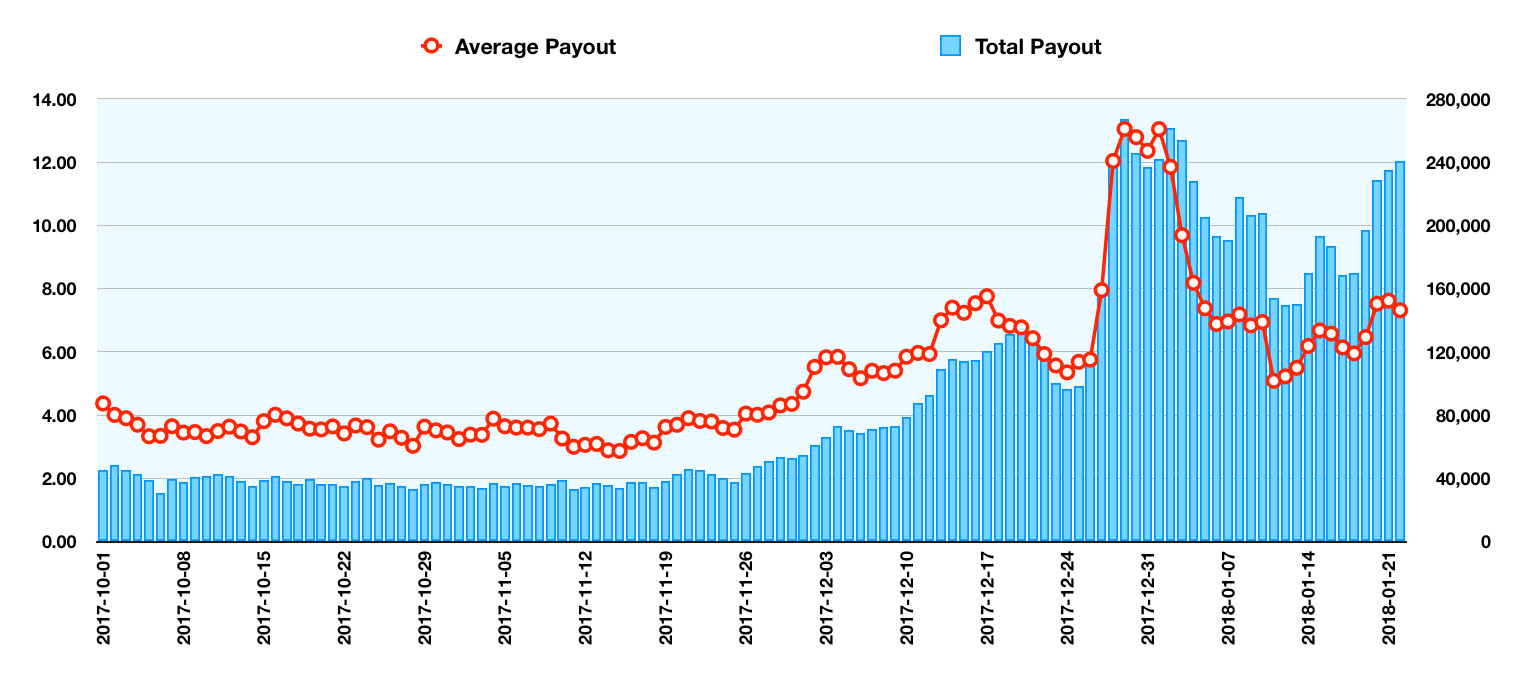
Here we can see that the spike in the Steem price and the increase in total payouts increases the average author earnings for a few days. However the increase in authors numbers soon drops the average payout back down again.
Over the full study period the average author earnings per day (mean, not median) increased from around $4 to something around $7, an increase of 80%. The total payouts increased by nearly 400% over the same period.
0.4 Percentiles of Average Author Earnings
Widening this third study from average author earnings per day to the percentiles of author earnings per day we can see a similar pattern.
(The percentiles are calculated by arranging author earnings for each day by size, then taking the result of the author who is 10% of the way up the chart, 20%, 30%, etc up to 90%. The 50% level will thus give the median author earnings).
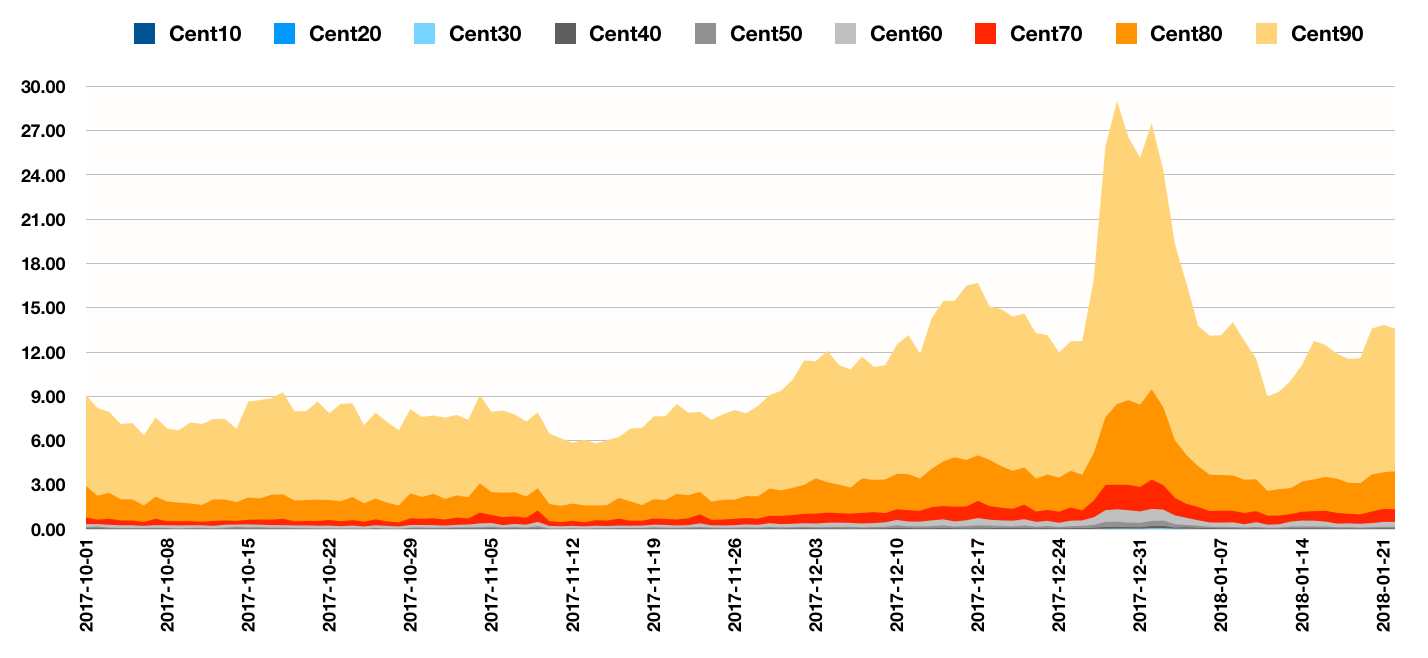
The pattern seen for average (mean) payouts is repeated here for each percentile.
The 50th percentile (median) is well below the average (mean) due to the skewed nature of the distribution of payouts.
It is perhaps a stark conclusion from looking at the 80th percentile that 80% of authors posting on a particular day earn $4 (i.e. 4 SBD at $1) or less, even after the rise in Steem price.
The average payout and the percentiles give a little weight to the viewpoint of the original commenter on which this study is based (i.e. that the Steem price had risen rapidly over January but, rather than benefitting from the rise, they felt that their author payouts had not increased.) Certainly the average has not increased in line with overall payouts.
However this is far from the whole story. It is likely that an influx of new users from a spike in the Steem price would bring many users who are, initially at least, earning very little. This would reduce down both the average payout and the percentiles but would not necessarily affect the payouts of an established author.
0.5 10th, 100th, 1000th, 2000th Author Earnings levels
In an attempt to view the issue from a different angle, I now look at the 10th, 100th, 1000th, and 2000th Author Earnings levels across the study period. These are not the earnings for particular authors over time, but will (most likely) be for different authors each day, depending on who happens to achieve that ranking on each particular day.
Here are the relevant charts for the rankings.
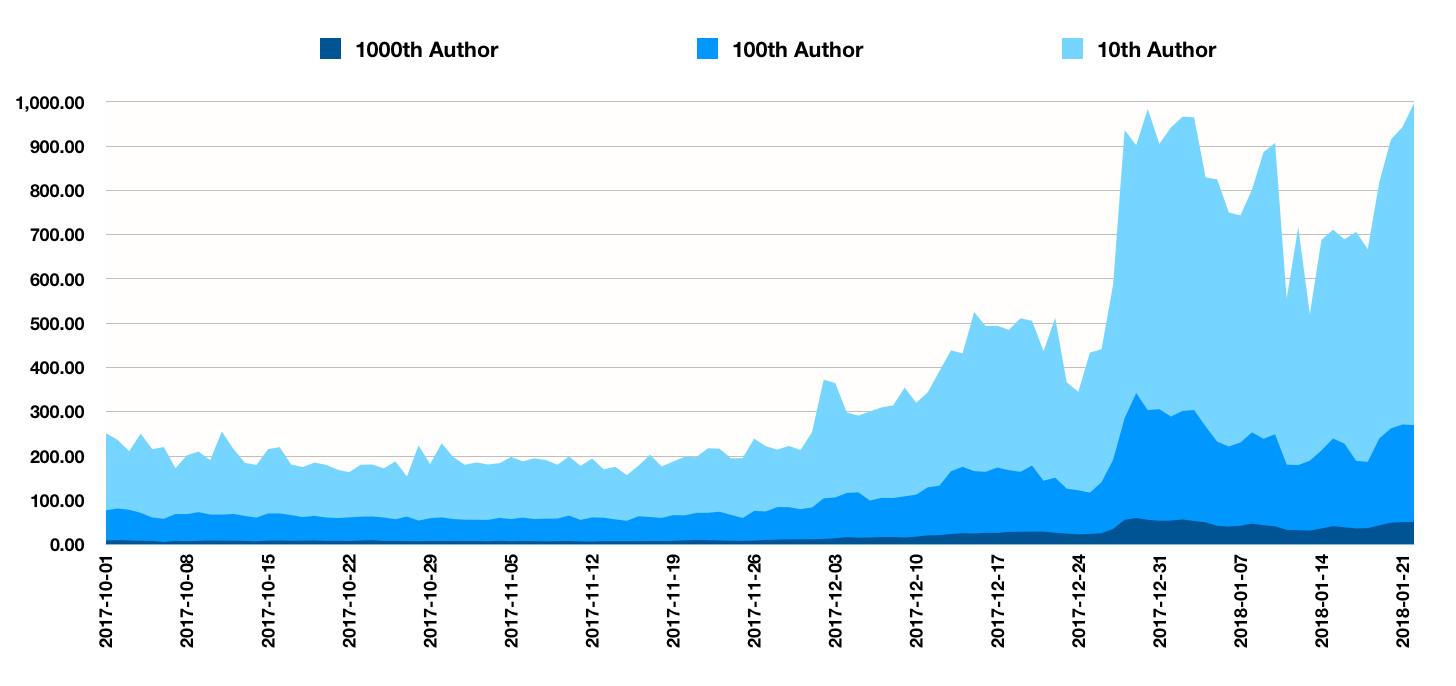
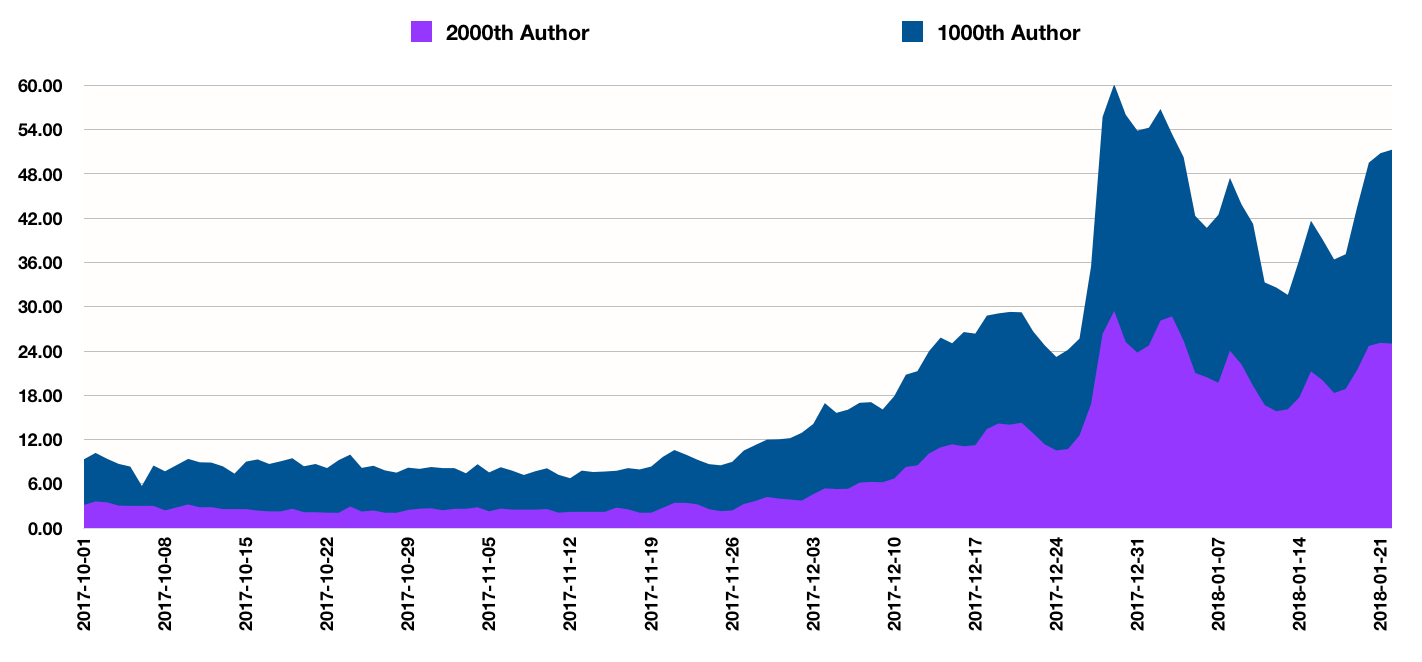
We can see that the earnings at each ranking follow a similar pattern to the total payout and are inflated by the rising Steem price. From the last chart we can see that the earnings for the 2000th author keep pace with, or potentially even exceed, the rate of growth of the Steem price.
Based on these charts we can see that if an author manages to maintain the same ranking over time, posting consistently every day, then they will benefit broadly in line with the rising Steem price.
Again however this is not the whole story. An individual author may start to fall down the rankings if a large number of the new authors that arrive are big earners. This was potentially the case over January with the success of platforms such as DTube attracting vloggers with large followings.
0.6 Following 10 Authors across the study period
As the final part of this study I took the 10 authors who were ranked from 995 to 1004 as at 1 October 2017 and followed their earnings progress across the full study period.
Here is the chart:
- The dark blue line is the 1000th author, to see if our chosen authors keep pace with their former ranking.
- The dark green line is the best performer from our 10 chosen authors (earnings are a 4 day rolling average to remove volatility).
- The orange line is the average of the next 3 best performing authors.
- The red line is the remaining 6 authors, some of whom posted very little after October.
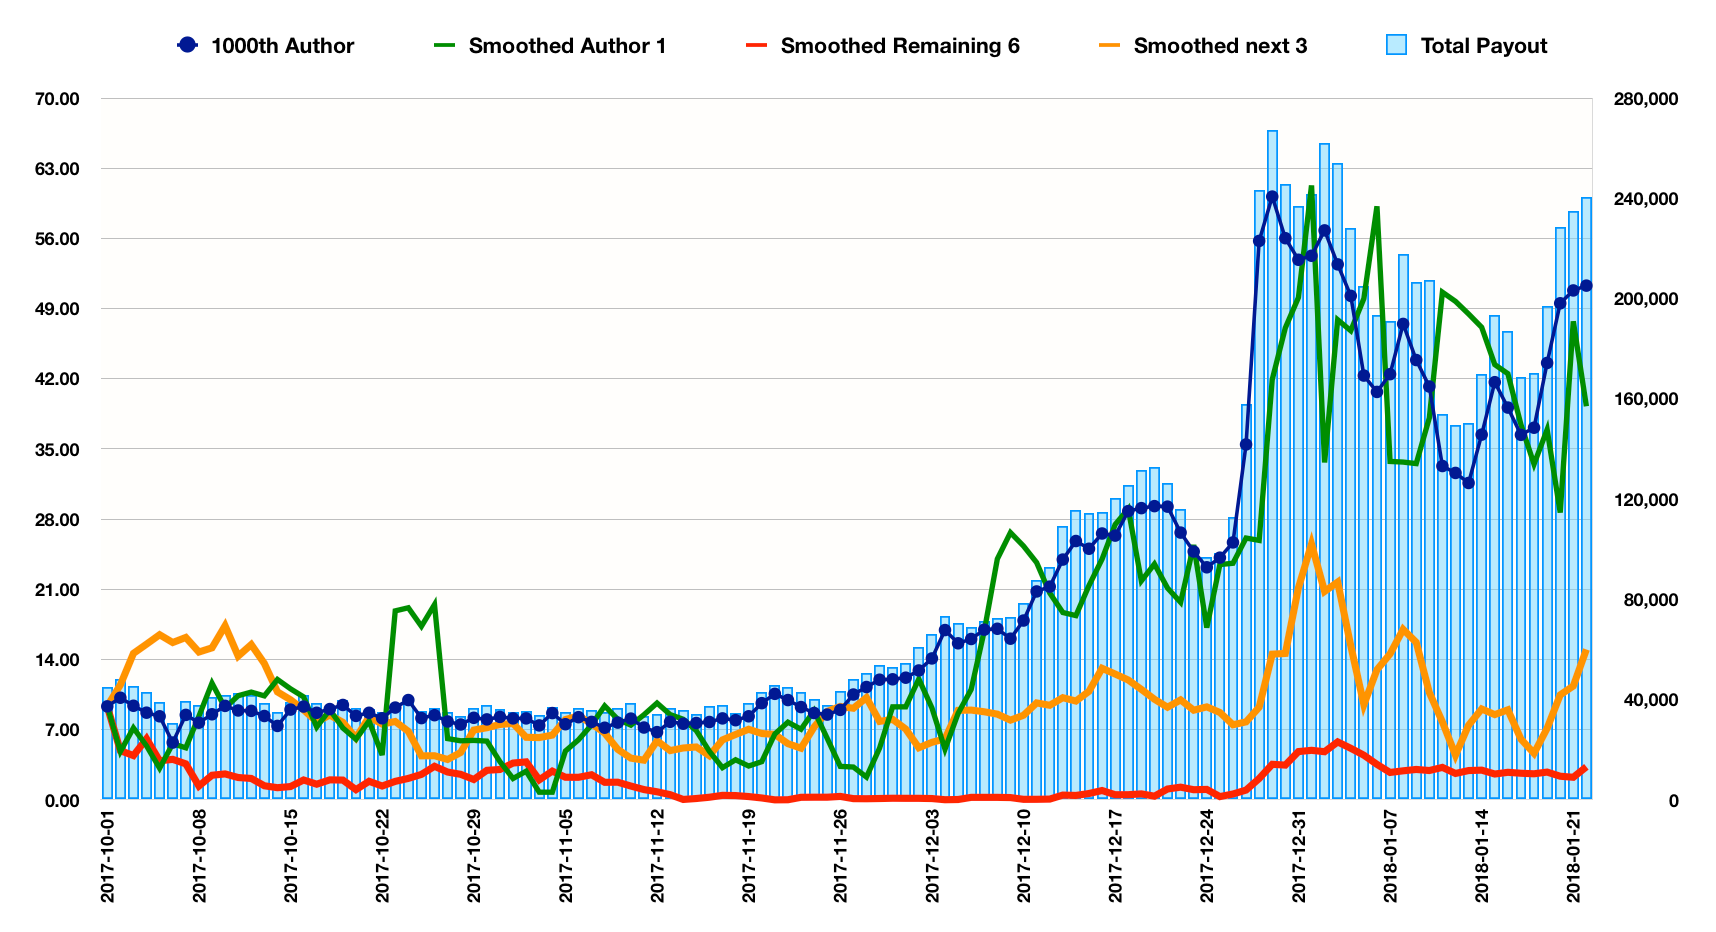
This final analysis is very “anecdotal”. A larger study with a much greater number of authors would potentially bring greater insight. However high level conclusions are as follows:
The best performing author has posted very regularly and managed to keep pace with the overall rewards available and the 1000th author ranking.
The next three best performers have also posted very regularly and seen an increase in rewards per day but nowhere near the level of the overall increase in available rewards.
The remaining six authors all have very significant gaps in their posting over the study period (i.e. gaps of a whole month) and their data is perhaps not relevant to the question being investigated.
0.7 Conclusions
Returning to the original question: Do earnings increase for individual authors when the Steem price rises, or not?
We have seen in this study that:
With a rising Steem price, the average author earnings increased over the study period by around 80% whilst the total payouts increased by nearly 400% over the same period. There is a dilution in average earnings from the increased number of posters per day.
If an author manages to maintain the same ranking over time (i.e. they remain the 1000th top earning poster) then they will benefit broadly in line with the rising Steem price. However the ability to do this may be the exception rather than the rule.
With the limited data in the last study in the analysis, it appears that even those authors who post consistently may drop down the ranking. These authors will benefit from the rising Steem price but to a much lesser extent. This may be the phonemenon seen by the original commentor.
Although I have not touched on these points in the study, two other conclusions are obvious:
The rise in Steem price will benefit those who hold Steem! (the study only looks at earnings, it does not consider capital gains).
Steem Power will be harder and harder to accumulate over time if the Steem price rises. It is not just that it is more expensive to buy-in, but that the constant amount of Steem given in rewards each day will be diluted between an increasing number of authors as they arrive attracted by the rising Steem price. Whilst the US dollar value of the earnings per author may still increase, the amount of Steem this represents will be lower. (So if you are setting targets for the year, you may want to think in “Value of Account” terms rather than setting goals based on Steem Power).
Outline
0 Summary of Findings and Conclusions (see above)
0.1 Rising Steem price impact on Total Author Payouts
0.2 Rising Steem price impact on Daily Author Numbers
0.3 Comparison of Total Payouts and Average Author Earnings
0.4 Percentiles of Average Author Earnings
0.5 10th, 100th, 1000th, 2000th Author Earnings levels
0.6 Following 10 Authors across the study period
0.7 Conclusions
1 Scope of Analysis
2 Tools Used
3 Scripts
1 Scope of Analysis
The analysis is based on the data for all user accounts who posted articles or comments on dates across the period October 1 2017 to January 22 2018.
The data has been obtained through SQL queries of SteemSQL, a publicly available Microsoft SQL database built and maintained by @arcange and containing all the Steem blockchain data.
The data has been filtered by date using the .created timestamps in the comments table.
2 Tools Used
DBeaver, a free data management tool, was used to run the SQL queries. The raw data was then verified and analysed and the graphs and charts were produced using Numbers, the Mac spreadsheet tool.
SQL scripts are included at the end of this analysis.
Summary of Findings
Analysis findings have been included in the Summary of Findings at the start of the report.
3 Scripts
The script required to run this analysis is long mainly due to repetition. I have removed the repeated terms so this analysis is not unnecessarily long - if there are any further questions just ask!
(The ... marks indicate where lines have been removed due to repetition. For example the code for the 20th percentile is exactly the same as that for the 10th, just with 0.1 changed to 0.2 and 10 changed to 20. I have also removed the names of any of the 10 authors followed as it does not add to the study.)
SELECT
    x.ArticleDate,
    MAX(x.Cent10) AS [Cent10],
        …
    MAX(x.No10) AS [No10],
        …
    Count (x.author) AS [CountAuthor],
    SUM(x.ArticleAuthorPayout) AS [TotalPayout],
        AVG(x.ArticleAuthorPayout) AS [AVGPayout],
        MAX(x.Author1) AS [Author1],
        …
FROM(
SELECT
        Comments.author AS [Author],
        CONVERT(Date, Comments.created) as [ArticleDate],
        sum(round(comments.total_payout_value,2)) as [ArticleAuthorPayout],
        round(PERCENTILE_CONT(0.1) WITHIN GROUP (ORDER BY sum(round(comments.total_payout_value,2)) ASC) OVER (PARTITION BY CONVERT(Date, Comments.created)),2) as [Cent10],
        …
       CASE WHEN RANK() OVER (PARTITION BY CONVERT(Date, Comments.created) ORDER BY sum(round(comments.total_payout_value,2)) DESC) = 10 THEN sum(round(comments.total_payout_value,2)) ELSE NULL END as [No10],
        …

        CASE WHEN comments.author in (‘insert_name_of_author_here’) THEN sum(round(comments.total_payout_value,2)) ELSE NULL END as [Author1],
        …
From
Comments (NOLOCK)
    WHERE
        CONVERT(Date, Comments.created) >= '2017-10-01' and
        CONVERT(Date, Comments.created) <= '2018-01-22'
    GROUP BY
        Comments.author,
        CONVERT(Date, Comments.created)
    ) as x
GROUP BY
    x.ArticleDate

ORDER BY
    x.ArticleDate
That's all for today. Thanks for reading!
Posted on Utopian.io - Rewarding Open Source Contributors