There are now many different applications and platforms that can be used to post on the Steem blockchain. These platforms are a key part of the value proposition of the blockchain and of the underlying Steem currency. The aim of this analysis is to provide an understanding of the growth and market share of these platforms, giving users some easily digestible figures to assess their continuing development.
This analysis covers:
- Background: An overall view of the Steem blockchain user metrics for January 2018 to provide a backdrop for the analyses that follow.
- Breakdown by Market Share: The breakdown and ranking of the key Steem blockchain user metrics by platform for the month of January 2018. Analyses are made for: Regular Posters, Post Numbers and Post Payouts. Comparisons are made to December 2017 showing the changes in ranking and the growth from December to January.
- Conclusions and Trends: A brief consideration of trends and drivers for the next few months.
0 Summary of Findings and Conclusions
I start by presenting the summary of findings for readers who have limited available time. The full details of the analysis are included in the later sections of this article.
Please note that throughout this analysis:
- The figures include only main posts; they do not include comments.
- All payouts considered throughout this article are expressed in the currency as seen on the Steemit interface, i.e. SBD treated as $1.
0.1 Background: An overall view of the Steem blockchain user metrics for January 2018
This first analysis provides an overview of the Steem blockchain user metrics for January 2018 to provide a backdrop for the analyses that follow.
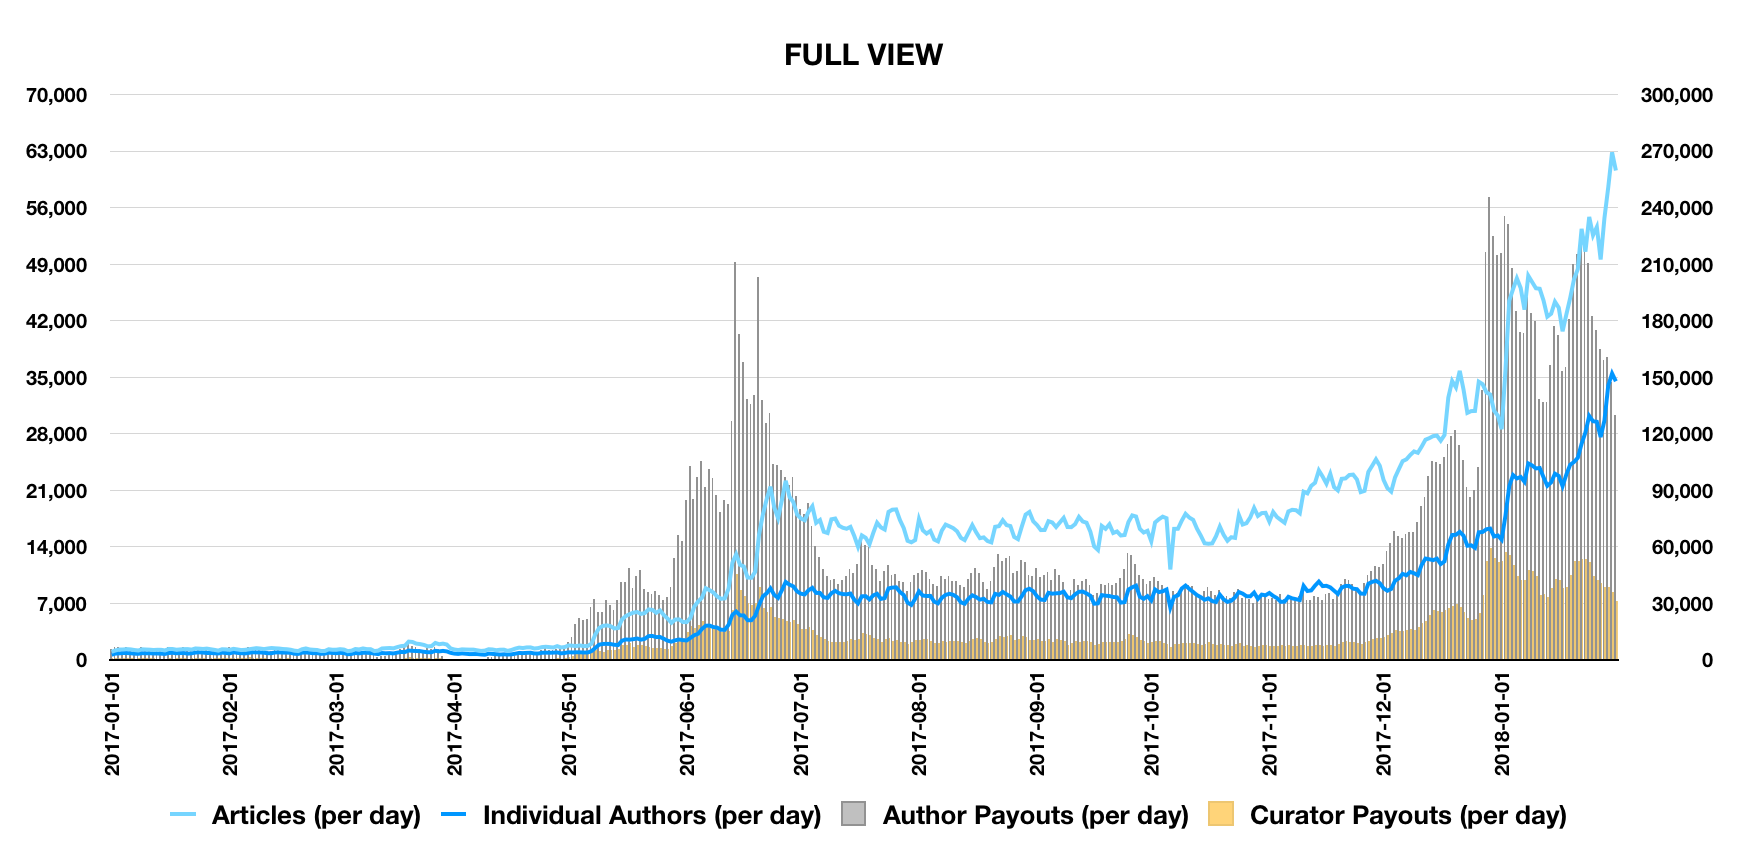
In the graphs below:
- The light blue line is the number of articles per day and the dark blue line is number of distinct authors. These are plotted against the left hand axis.
- The silver columns are author rewards and the gold columns are curator rewards. These are plotted against the right hand axis.
Full View across 2017 and 2018:
Focus on last three months:
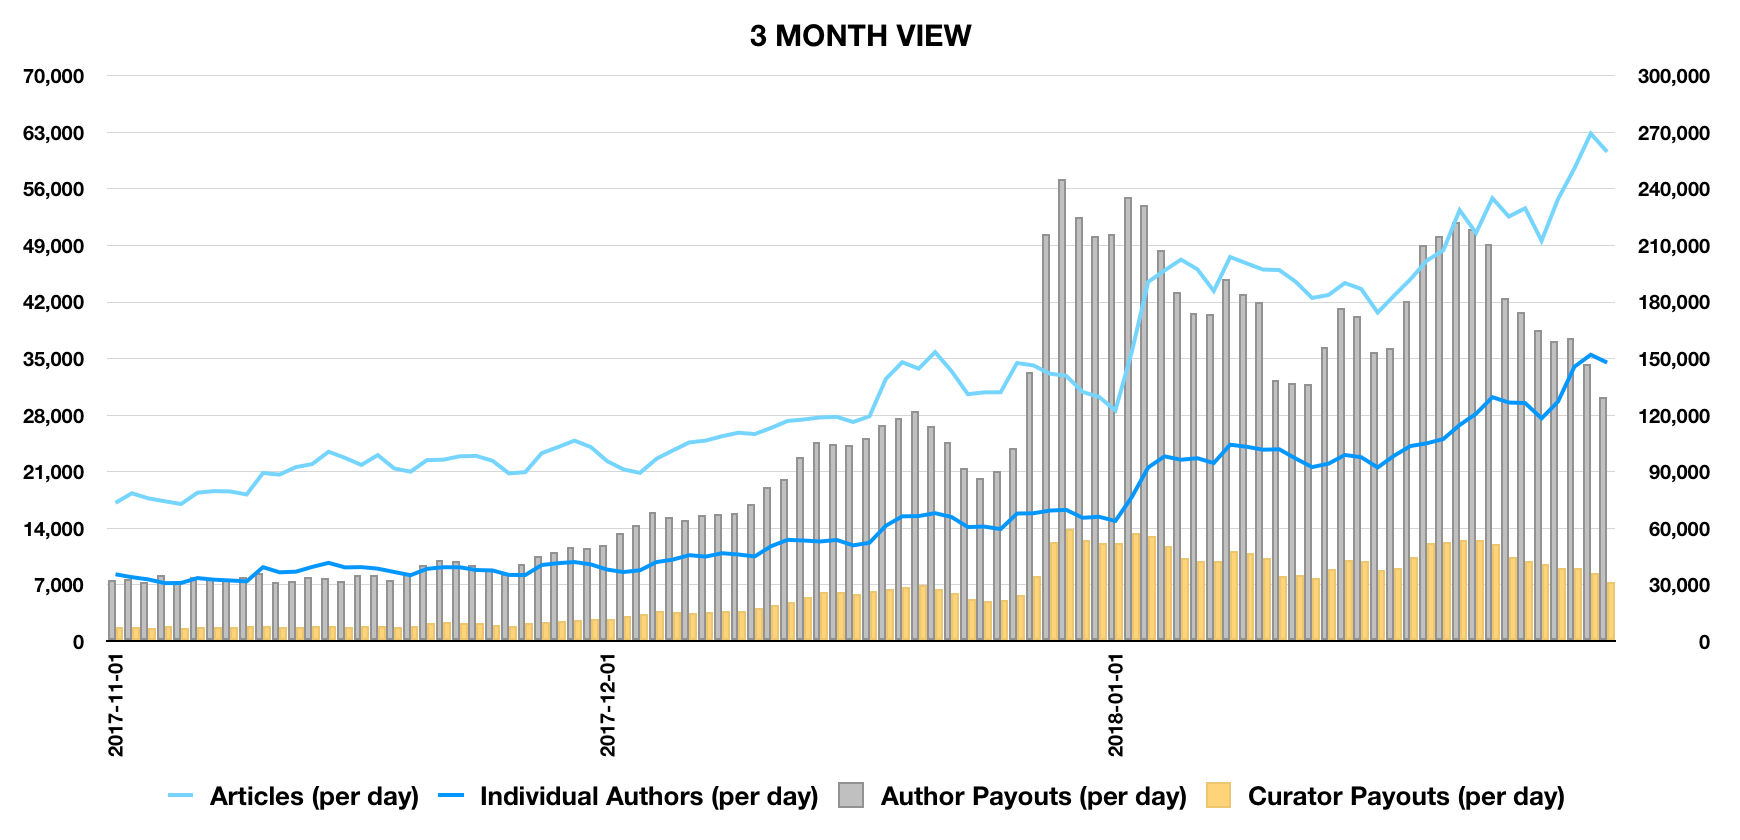
The exponential increases in post numbers per day and individual authors per day seen in December continue through January 2018.
Author numbers per day have doubled from the end of December to the end of January - from around the 15,000 level to the 30,000 level.
Post numbers have increased by approximately 75% from the 32,000 level to around 56,000. This latter number has also been reduced by a significant crackdown against automated posts on the blockchain over January 2018.
Post payouts per day are also clearly higher over January 2018 than December 2017 although the level fluctuates across the month. The pattern of post payouts is driven to a large extent by the underlying Steem price which has shown great volatility over January 2018 (volatility which has been present in the crypto market as a whole).
This overall picture is very healthy, illustrating both the continuing adoption of the Steem blockchain by users and a strengthening of the Steem proposition in the marketplace (the higher Steem price brings higher payouts).
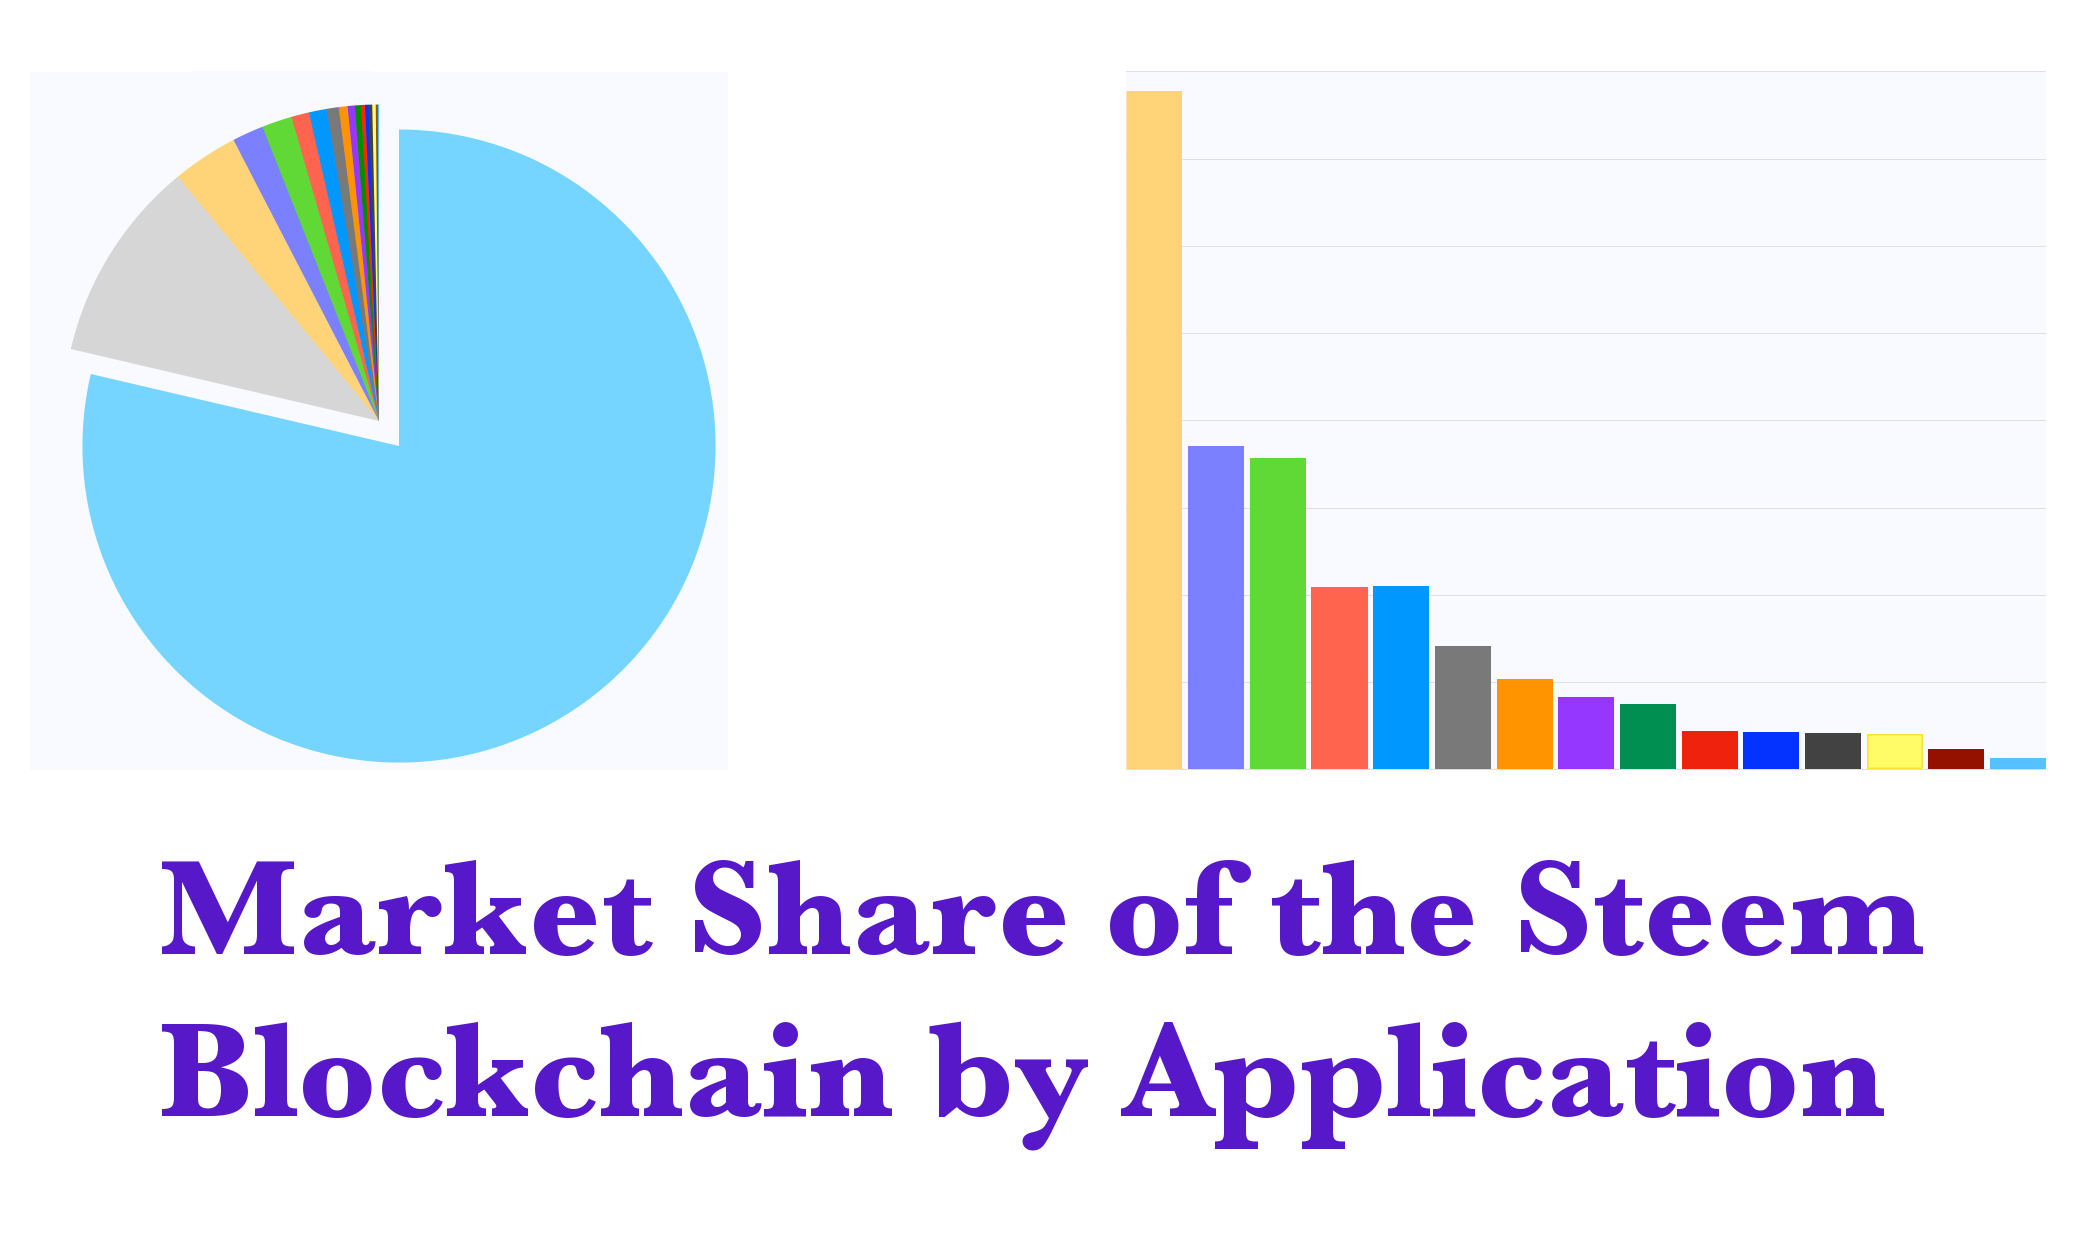
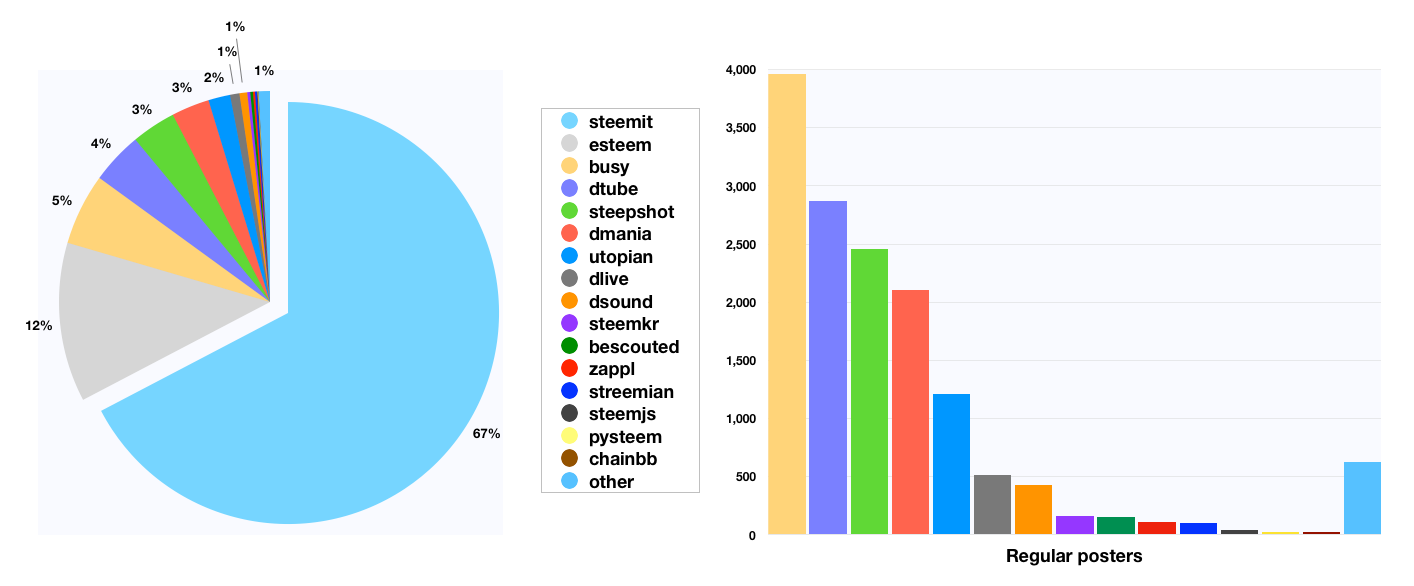
0.2 Breakdown by Market Share: Regular Posters
For the breakdown by market share we start by looking at regular poster numbers. I have defined regular posters as users that have posted four or more articles over the month.
The following table shows the number of regular posters for each application over January. The "Change" column is a comparison to the month of December. The rankings are shown for January, with the December ranking in parentheses.
| Application | Regular posters | Change | Ranking |
|---|---|---|---|
| steemit | 48,653 | +83% | 1 (1) |
| esteem | 8,822 | +121% | 2 (2) |
| busy | 3,959 | +151% | 3 (3) |
| dtube | 2,871 | +314% | 4 (5) |
| steepshot | 2,455 | +176% | 5 (4) |
| dmania | 2,102 | +543% | 6 (7) |
| utopian | 1,211 | +94% | 7 (6) |
| dlive | 516 | +1,295% | 9 (14) |
| dsound | 433 | +1,253% | 10 (16) |
| steemkr | 162 | +20% | 11 (9) |
| bescouted | 152 | +124% | 12 (12) |
| zappl | 108 | +8% | 13 (10) |
| streemian | 102 | +19% | 14 (11) |
| steemjs | 39 | +117% | 15 (17) |
| pysteem | 28 | -15% | 16 (15) |
| chainbb | 26 | -43% | 17 (13) |
| other | 629 | +163% | 8 (8) |
| Total Result | 72,268 | +104% |
There has been a significant increase in regular users across the whole blockchain (+104%). Regular user numbers rose particularly strongly for dtube, dmania, dsound, and dlive. The increases for these four platforms will partly be driven by their recent receipt of large delegations of Steem Power (indirectly) from the main @steemit account, allowing increased marketing and rewards from their platforms.
With regards to the rankings the top three places were unchanged, whilst in the chasing pack dtube and dmania both rose one place, to fourth and sixth respectively.
In terms of market share, steemit.com now contributes 67% of regular user numbers, a significant drop from 75% in December, whilst all other applications combined have now risen from 25% to 33%.
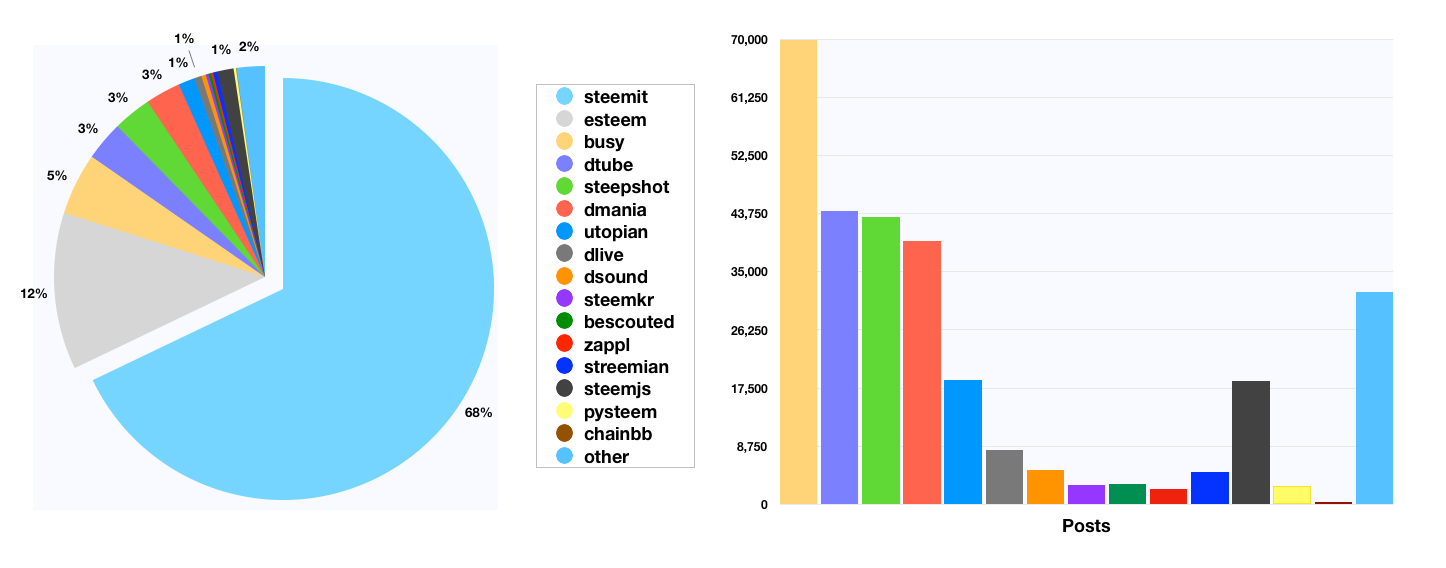
0.3 Breakdown by Market Share: Post Numbers:
The next analysis looks at post numbers (it should be noted that the number of posts does not include comments).
The following table shows the number of posts for each application over January. Again, the "Change" column is a comparison to the month of December.
The order in the table has been maintained from the "Regular Users" table to illustrate how different applications may have different market share rankings depending on which metric is applied (and it should also be noted that the usefulness of the various metrics differs between one application and another).
| Application | Posts | Change | Ranking |
|---|---|---|---|
| steemit | 998,527 | +62% | 1 (1) |
| esteem | 176,856 | +102% | 2 (2) |
| busy | 69,833 | +134% | 3 (5) |
| dtube | 44,131 | +259% | 4 (8) |
| steepshot | 43,255 | +161% | 5 (6) |
| dmania | 39,585 | +188% | 6 (7) |
| utopian | 18,633 | +91% | 8 (9) |
| dlive | 8,159 | +1,655% | 10 (17) |
| dsound | 5,119 | +896% | 11 (16) |
| steemkr | 2,941 | +36% | 14 (12) |
| bescouted | 3,027 | +148% | 13 (14) |
| zappl | 2,312 | +23% | 16 (13) |
| streemian | 4,834 | -4% | 12 (11) |
| steemjs | 18,514 | -47% | 9 (4) |
| pysteem | 2,775 | -64% | 15 (10) |
| chainbb | 412 | -40% | 17 (15) |
| other | 31,890 | -32% | 7 (3) |
| Total Result | 1,470,803 | +66% |
There has been a significant increase in post numbers (+66%) for the month of January when compared to December. As for regular user numbers, growth was particularly strong for dtube, dmania, dsound, and dlive each of which more than doubled their post numbers.
With regards to the rankings, busy and dtube jumped up into third and fourth positions with steepshot also climbing into the top 5. The big fallers, steemjs and “other” were driven by a clampdown on automated posting on the blockchain.
The market share figure for steemit.com is similar to that derived by regular posters at 68%. Steemjs and “other” have dropped from a combined 9% to 2%.
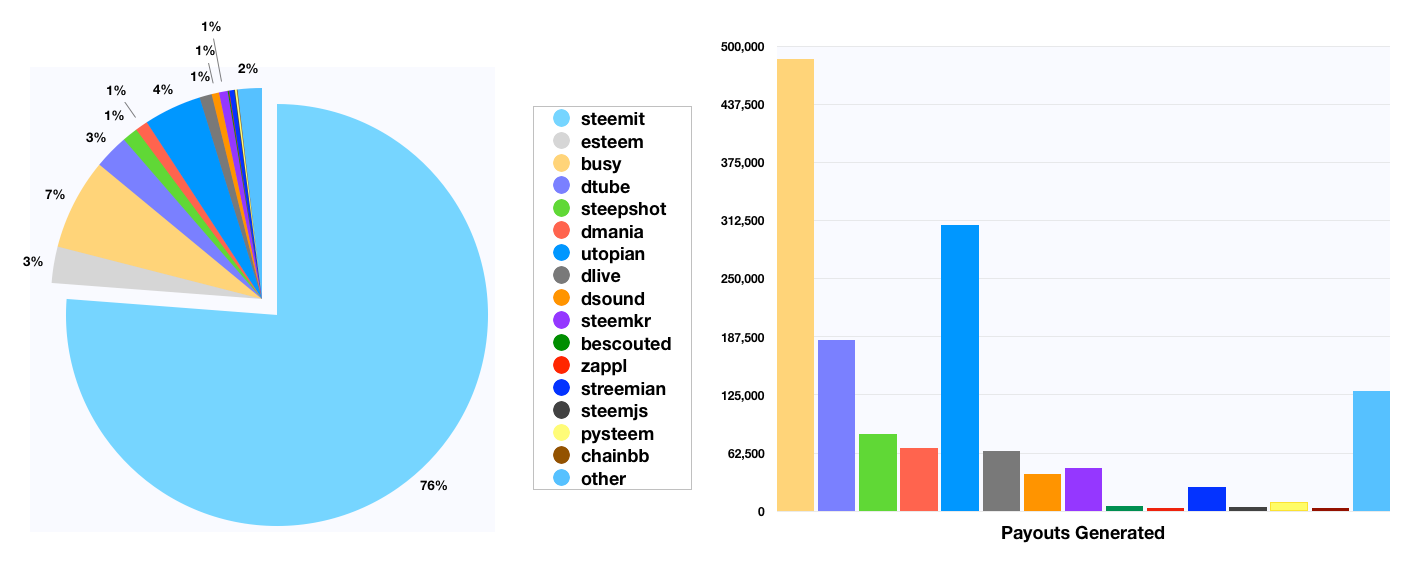
0.4 Breakdown by Market Share: Post Payouts:
Finally, a consideration of post payout numbers.
The following table shows the amount of post payout for each application over January. Again, the "Change" column is a comparison to the month of December.
(Figures have been extracted at 8 February so all post payouts should be final).
| Application | Payouts Generated | Change | Ranking |
|---|---|---|---|
| steemit | 5,300,793 | +65% | 1 (1) |
| esteem | 193,661 | +33% | 4 (4) |
| busy | 486,428 | +95% | 2 (2) |
| dtube | 184,026 | +126% | 5 (5) |
| steepshot | 83,077 | +79% | 7 (7) |
| dmania | 67,550 | +515% | 8 (11) |
| utopian | 307,346 | +39% | 3 (3) |
| dlive | 65,151 | +3,730% | 9 (16) |
| dsound | 39,761 | +4,649% | 11 (17) |
| steemkr | 45,992 | +18% | 10 (8) |
| bescouted | 5,592 | +58% | 14 (13) |
| zappl | 3,006 | -9% | 17 (14) |
| streemian | 25,823 | +12% | 12 (10) |
| steemjs | 4,435 | +54% | 15 (15) |
| pysteem | 9,914 | -66% | 13 (9) |
| chainbb | 3,395 | -8% | 16 (12) |
| other | 129,298 | +109% | 6 (6) |
| Total Result | 6,955,247 | +68% |
Overall post payouts increased by 68% from December to January, largely driven by the rise in Steem price. As for the other metrics, growth was particularly strong for dtube, dmania, dsound, and dlive.
With regards to the rankings, the top seven places were unchanged with busy solidifying their second ranking after posting stronger growth than both steemit and utopian in first and third. Dmania and dlive jumped up into eighth and ninth with payout growth of over 6x and 38x respectively.
The market share figure for steemit.com is much higher on a post payout basis than for the other metrics.
0.5 Conclusions and Trends:
The overall picture for the blockchain is very healthy, with strong growth under all three metrics. However the cryptocurrency markets and the Steem price have come down significantly from highs in early January which suggest post payouts may decline from January to February. It will be interesting to see whether this has a corresponding impact on user and post numbers.
The strongest growth and largest climbs in rankings came from dtube, dmania, dsound and dlive. Each of these platforms received significant delegations in December 2017 or January 2018 allowing them to increase market share through marketing of higher payouts to users. With a doubling of the delegation to dtube yesterday and new significant delegations to both esteem and zappl I would expect these latter three platforms to show well over February.
Outline
- 0 Summary of Findings and Conclusions (see above)
- 0.1 Background: An overall view of the Steem blockchain user metrics for January 2018
- 0.2 Breakdown by Market Share: Regular Posters
- 0.3 Breakdown by Market Share: Post Numbers
- 0.4 Breakdown by Market Share: Post Payouts
- 0.5 Conclusions and Trends
- 1 Scope of Analysis
- 2 Tools Used
- 3 Scripts
1 Scope of Analysis
The analysis is based on the data for all user accounts over December 2017 and January 2018.
The data has been obtained through SQL queries of SteemSQL, a publicly available Microsoft SQL database built and maintained by @arcange and containing all the Steem blockchain data.
The data has been separated by application by use of the app label information in the json_metadata column of the Comments table. One limitation of this approach is that modifying an article in another application causes the app label information in the json_metadata column to change to that of the modifying platform. However it is expected that this limitation has minimal effect.
The data has been filtered by date using the .created timestamps in the comments table
2 Tools Used
Valentina Studio, a free data management tool, was used to run the SQL queries. The raw data was then verified and analysed and the graphs and charts were produced using Numbers, the Mac spreadsheet tool.
SQL scripts are included at the end of this analysis.
Summary of Findings
Analysis findings have been included in the Summary of Findings at the start of the report.
3 Scripts
I used the following script to obtain the data:
SELECT
    Comments.author AS [Author],
     IIF(isjson(json_metadata) = 1, IIF(CHARINDEX('/', json_value(json_metadata, '$.app')) > 0, SUBSTRING(json_value(json_metadata, '$.app'), 1, CHARINDEX('/', json_value(json_metadata, '$.app'))-1),json_value(json_metadata, '$.app')), null) as [SummarisedApp],
    Count(Comments.author) AS [Posts],
    Count(distinct Comments.author) AS [DistinctCommentAuthor],
    count(Comments.parent_author) AS [ParentAuthor],
    count(distinct Comments.parent_author) AS [DistinctParentAuthor],
    sum(CONVERT(REAL,Comments.pending_payout_value)) AS [PendingPayoutValue],
    sum(CONVERT(REAL,Comments.curator_payout_value)) AS [CuratorPayoutValue],
    sum(CONVERT(REAL,Comments.total_payout_value)) AS [TotalPayoutValue]

FROM
    Comments (NOLOCK)

WHERE
    YEAR(Comments.created) = 2018 AND
    MONTH(Comments.created) = 1 and
    depth = 0

GROUP BY
    Comments.author,
    IIF(isjson(json_metadata) = 1, IIF(CHARINDEX('/', json_value(json_metadata, '$.app')) > 0, SUBSTRING(json_value(json_metadata, '$.app'), 1, CHARINDEX('/', json_value(json_metadata, '$.app'))-1),json_value(json_metadata, '$.app')), null)
A very similar script was used for the extraction of data by day. Briefly the small differences were:
- Replacement of author by comment creation date in both SELECT and GROUP BY clauses.
- Change of dates in WHERE clause to allow full calendar of data to be obtained
That's all for today. Thanks for reading!
Posted on Utopian.io - Rewarding Open Source Contributors