Details
Commenting thoughtfully on authors' post can be rewarding in multiple ways. I've learned this early on in my now nearly six months journey in Steemit. I wasn't really thinking about getting upvotes for my comments, I just thought that commenting is a great way to adding value to the authors' work by sharing my thoughts, genuinely express my appreciation of other authors' works, and announcing my presence to the community.
It was only about a month or two after joining when I learned how commenting can actually be financially rewarding too. At some point my comments were getting more dollar value in terms of upvotes than my authored posts.
In this contribution I will be presenting the distribution of of total_payout_value between posts and comments, and the movement or trend of that distribution.
Outline
To briefly give you an idea on how the data will be presented, this analysis will be covering these topics:
- The overall distribution of total_payout_value between posts and comments
- The trend of the distribution of total_payout_value between posts and comments by month
- A correlation between the total_payout_value of comments, and the count of comments
- A correlation between the average price of Steem and the total_payout_value of comments as a result of identified anomalies in the trend.
- Top commentors with the highest total_payout_value on their comments
- Top authors whose comments on posts have the highest total_payout_value
Scope of Analysis
I generated the data to present the distribution of total_payout_value between posts and comments from inception in March 2016 to January 10, 2018. In the charts however that require showing trends, I left the January 2018 data because the data is not yet complete. I did that to avoid showing a skewed trend-line.
In the charts where I showed top authors and parent authors, I am only showing the top 25, beyond that count will be extremely difficult to put in charts without negatively affecting the look and feel, and clarity of the information when done in excel.
Tools
I used arcange's Steem SQL Public Database to acquire the data-points related to the count of comments, posts, total_payout_value, author, and parent_author. To get the monthly average price of Steem I used coinmarketcap's historical data feature.
I know the the entire Comment table data will not fit in an excel spreadsheet. I used the following queries plotted as a pivot table in excel:
For the monthly trends and overall distribution:
SELECT
DATEADD(MONTH, DATEDIFF(MONTH, 0, created), 0) AS [year_month_date_field],
COUNT (total_payout_value), SUM (total_payout_value), parent_author
FROM Comments
GROUP BY created, parent_author
I added the parent_author column to use as filter between parent posts and comments. By filtering the parent_author to only "blank" shows the posts, and by selecting everything else but the blank shows the comments.
For top authors and parent_authors:
SELECT
COUNT (total_payout_value), SUM (total_payout_value), parent_author, author
FROM Comments
GROUP BY parent_author, author
I could have also ran a single query to get all the data to build all the charts together, but that would have taken more time, took necessary amount of bandwidth from arcange's free Steem SQL Public Database, and took toll on my old computer's processor.
To get the monthly average Steem price, I took the daily closing price of Steem from coinmarketcap and took a straight average per month.
Results
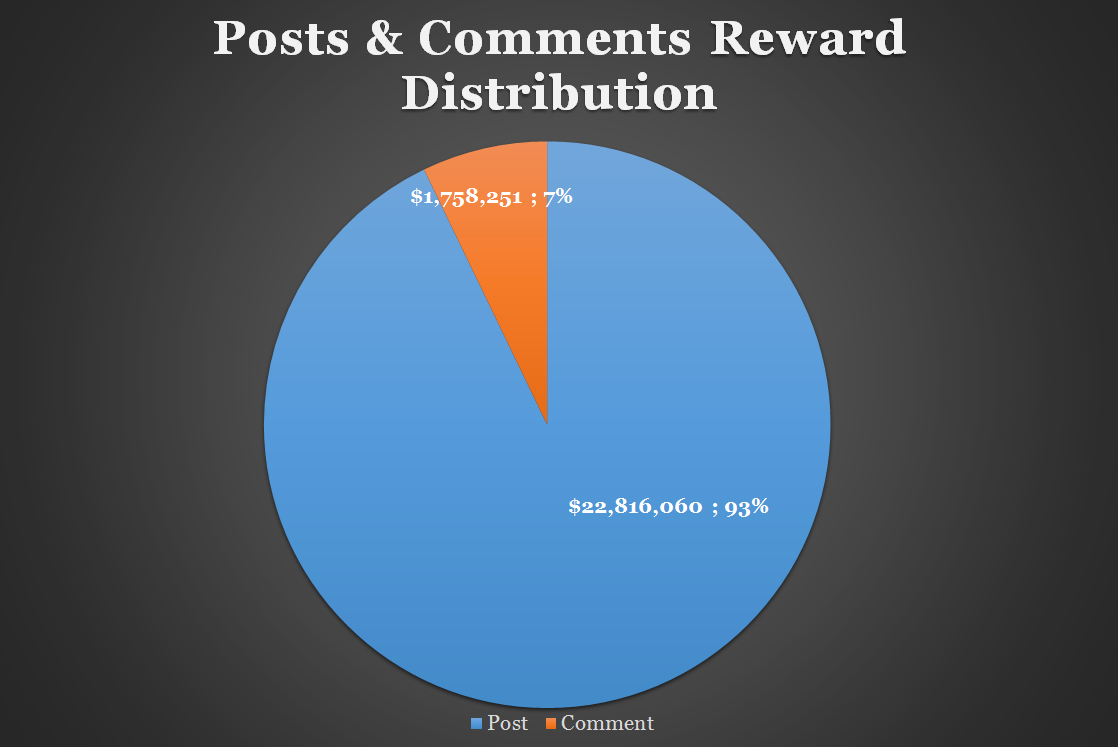
Overall, the data shows that the total_payout_value is distributed 93% to posts, and 7% to comments from inception in March 2016 to January 10, 2018.
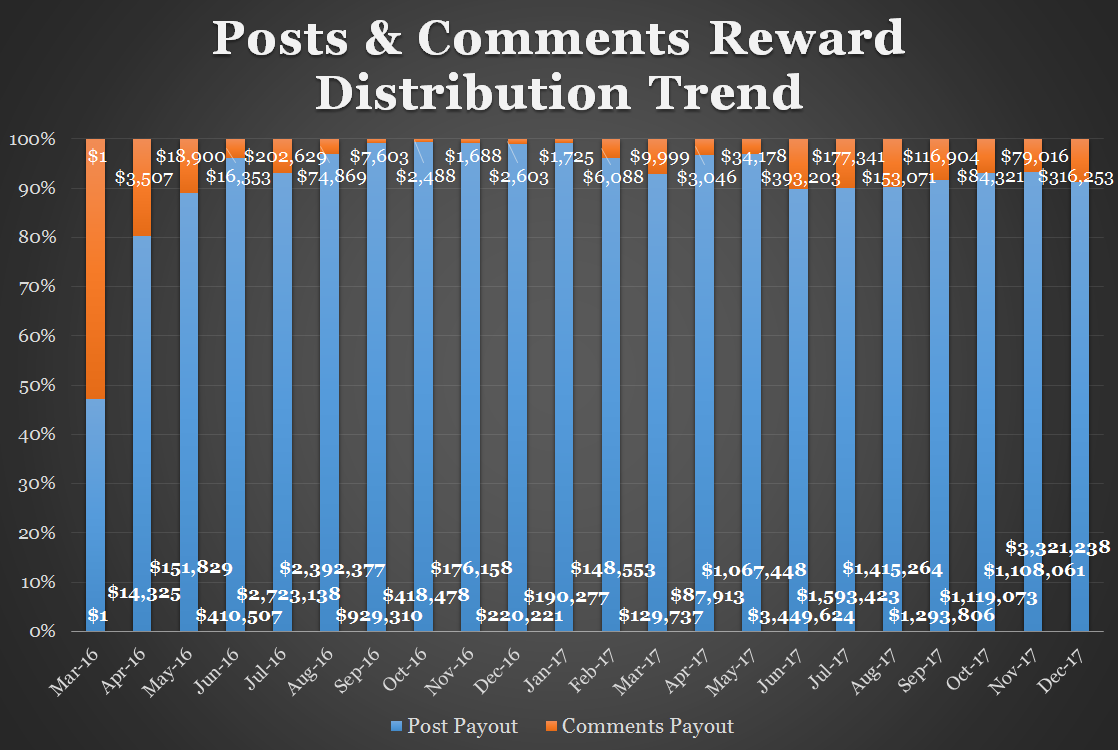
Trend of Distribution
From this chart it can be seen that in the second half of 2016, comments were only getting 2.25% of the reward, this increased to 4.78% in the first half of 2017, and increased further to 8.40% in the second half of 2017.
This tells us that the community is starting to really give value to thoughtful comments or an extensive farming is happening done in comments. The later is not a subject of this analysis however. I might take a look at that angle in another contribution.
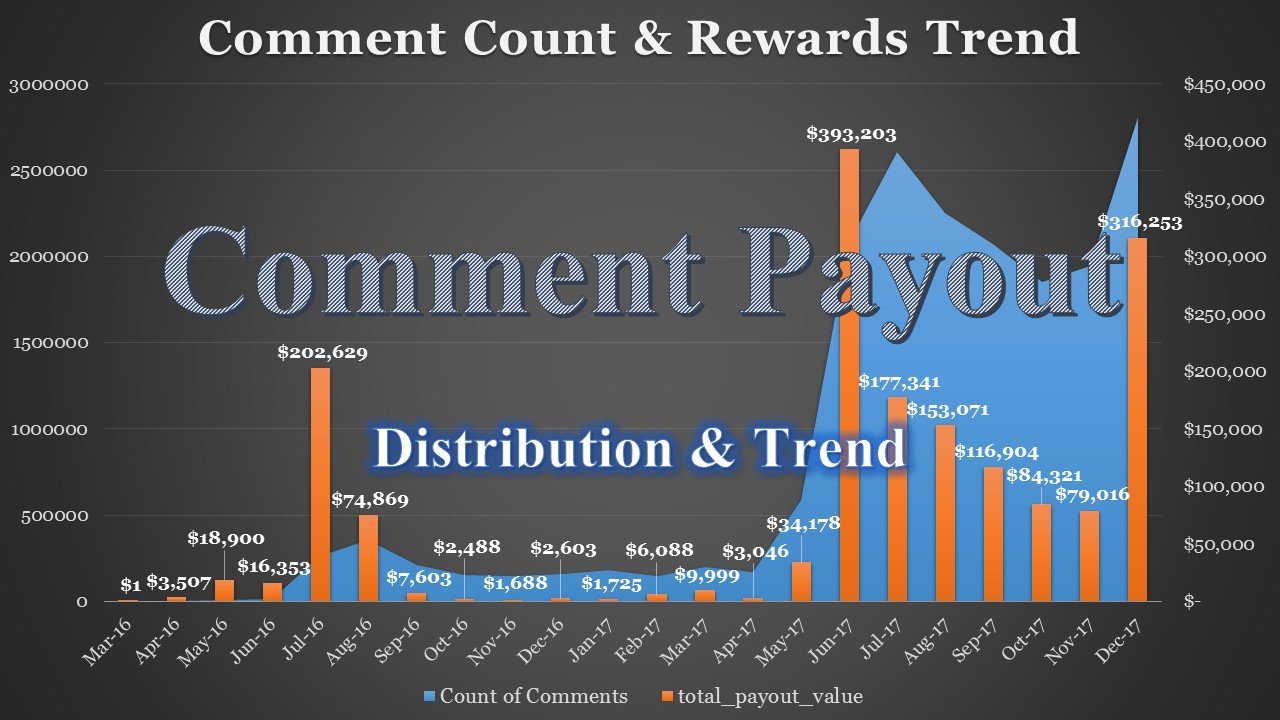
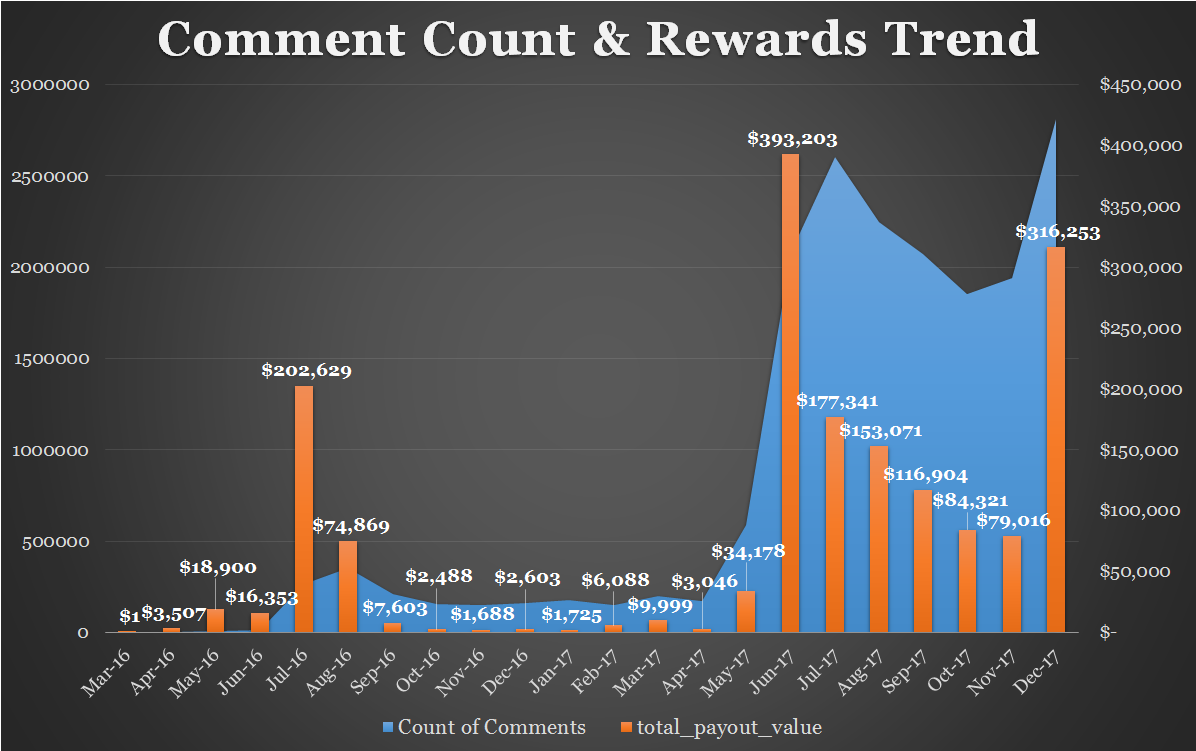
Comment Count & total_payout_value Trend Per Month
This chart shows an overall uptrend and a direct correlation between the count of comments and the total_payout_value on comments. There are anomalous months however ie. July 2016, August 2016, and June 2017.
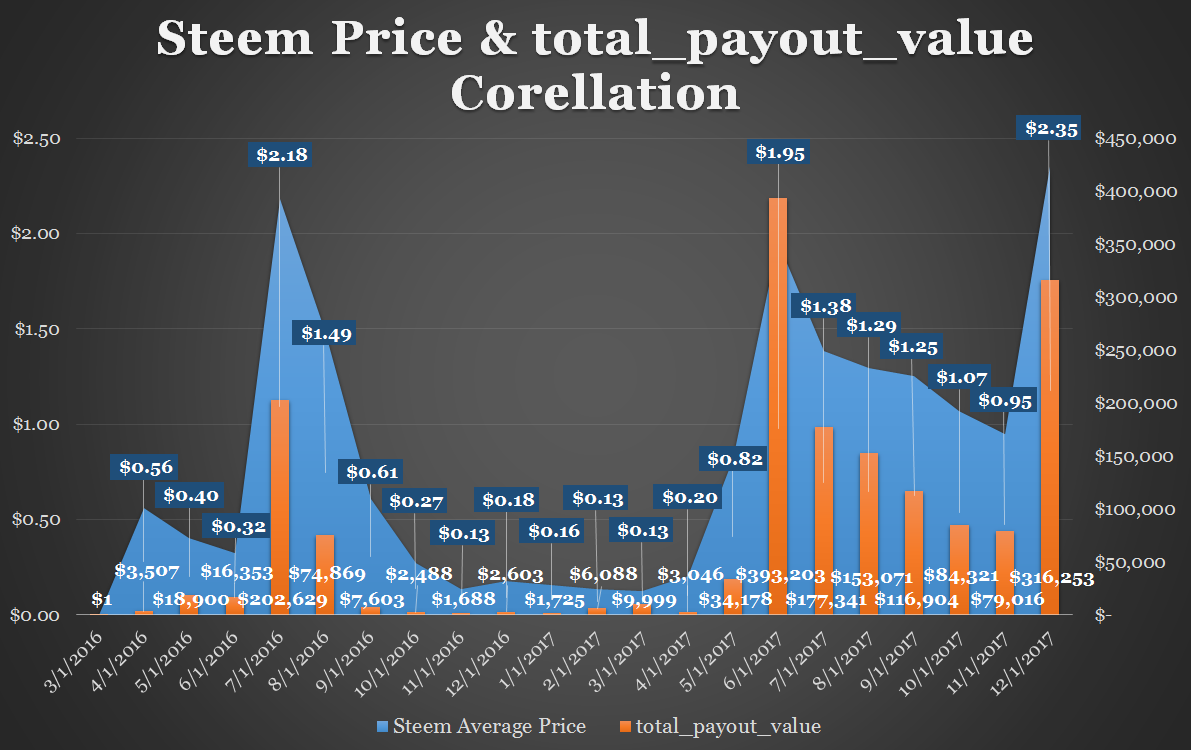
Steem Price & total_payout_value Trend Per Month
To clarify what seemed to be anomalous months in the previous chart, I plotted the average closing price of Steem against the total_payout_value of comments by month. The chart shows that what earlier seemed to be anomalous can be explained by significant rally in the price of Steem on those months.
Top 25 Commentors Based on total_payout_value
This shows the 25 top most rewarded commentors. This contribution is not intended to dwell into the details of where the upvotes they got are coming from, since that will require a whole new analysis.
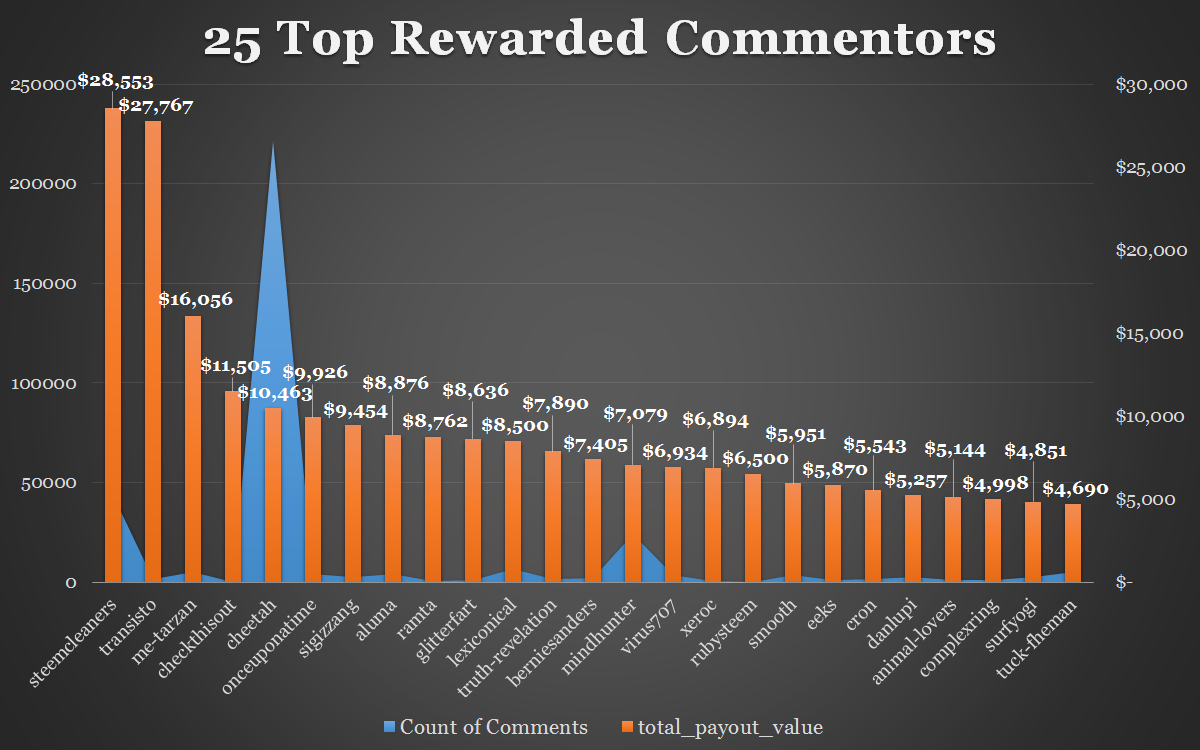
It is important to note though that steemcleaners and the bot cheeta are known to be supported for the work they are doing in guarding the reward pool from farmers and plagiarists. There's been several post about the unusual upvotes on checkthisout's comments.
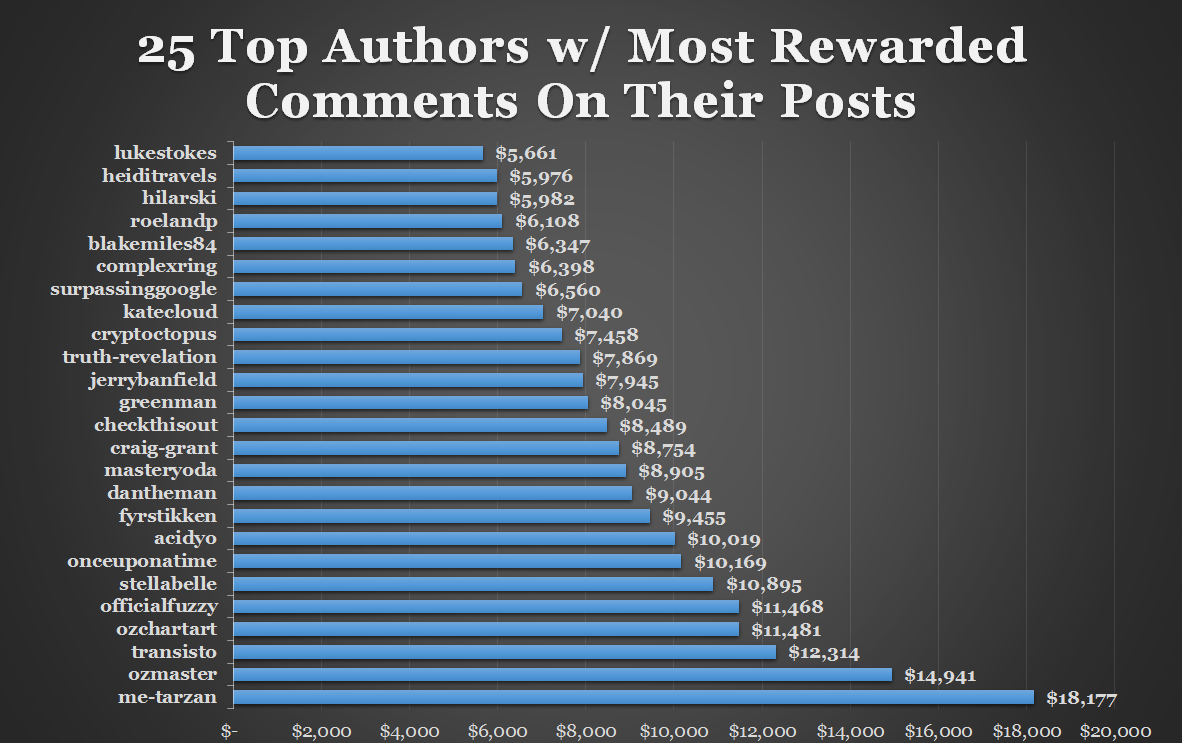
Top 25 Authors Based on total_payout_value of Comments on Posts
It is known to the community that there are authors whose comments on post gets rewarded by upvotes. Here is the top 25 of them arranged by total_payout_value of the comments on theirs posts.
The data presented in this analysis is intended to encourage users specially the newbies to engage with the community by first reading and appreciating the work of other users, then adding value to the content or expressing genuine appreciation of others' works. Not only that commenting will have the long term benefit of building connection, it can also be rewarding in the short-term with upvotes.
Posted on Utopian.io - Rewarding Open Source Contributors