Components
Data Stats is an Android application which allow users to monitor their upload and download data speed. This app is useful for users who want to check their data connection and monitor the speed of it. However, this app can be improve if it allow users to see their data connection speed within a time interval and with a chart. The feature I want to suggest that will have major positive impact for this app is:
- Data Throughput Chart
Proposal
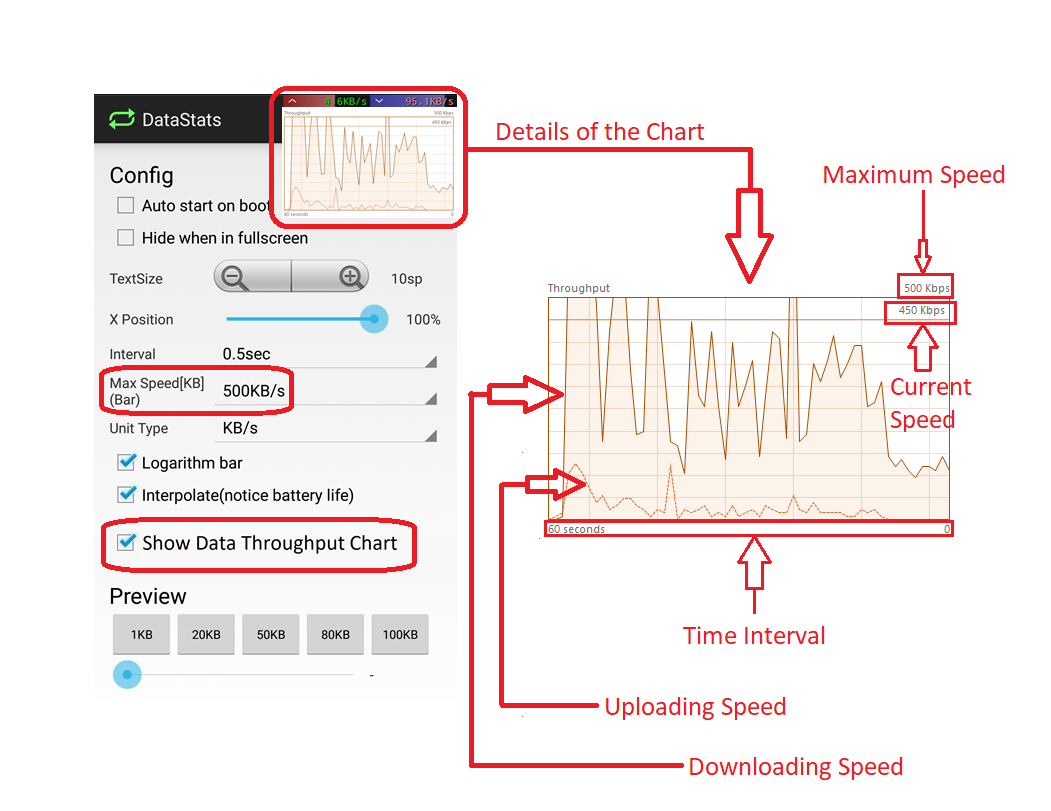
Data Throughput Chart served as a area chart with a time interval of 60 seconds which will show the detail values of uploading speed and downloading speed. The uploading speed represented by the dotted line while the downloading speed will be the solid line. The height and length of the line will represent how fast or how slow the uploading/downloading speed.
Mockups / Examples

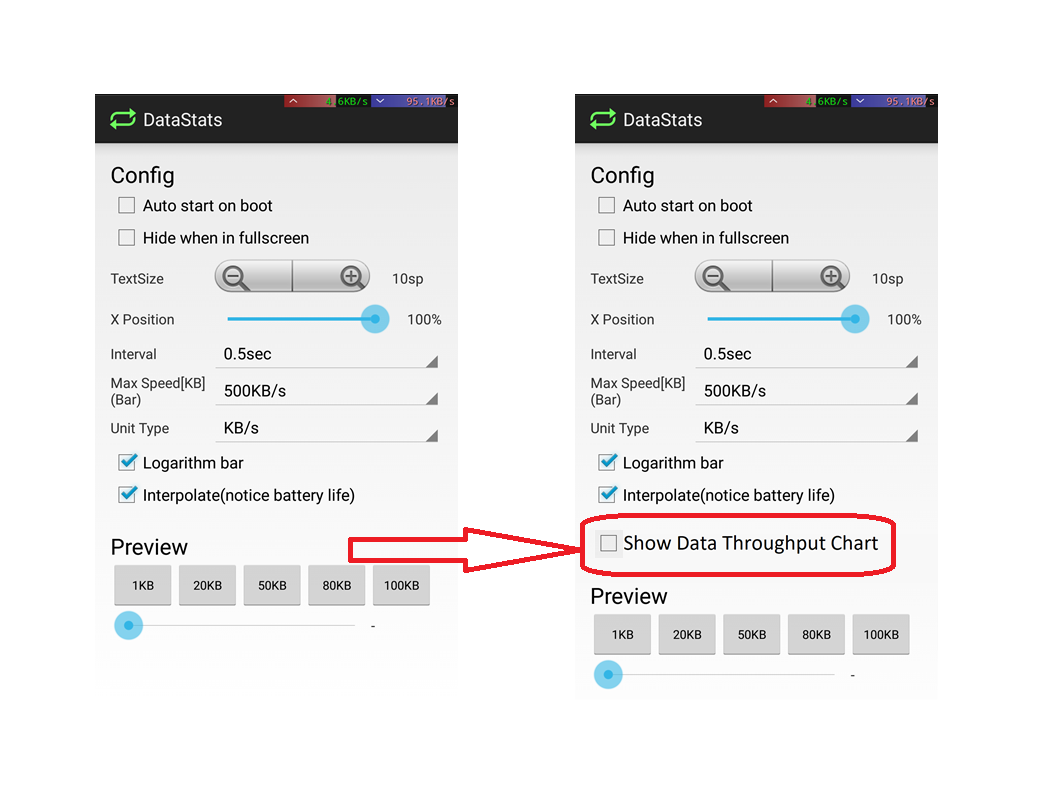
Location of the feature

Data Throughput Chart
Benefits
Data Throughput Chart will help users to easily monitor of their data speed because Data Throughput Chart shows the better details of their data within the time interval and it is very easy to see and keep in track of the details of the uploading speed and downloading speed. With that feature, users can adjust their data usage according to their data connection speed. I believe if the proposed features will be implemented, it will be a great advantage for users of this application as well as this app will be more useful, efficient and reliable.
Posted on Utopian.io - Rewarding Open Source Contributors
