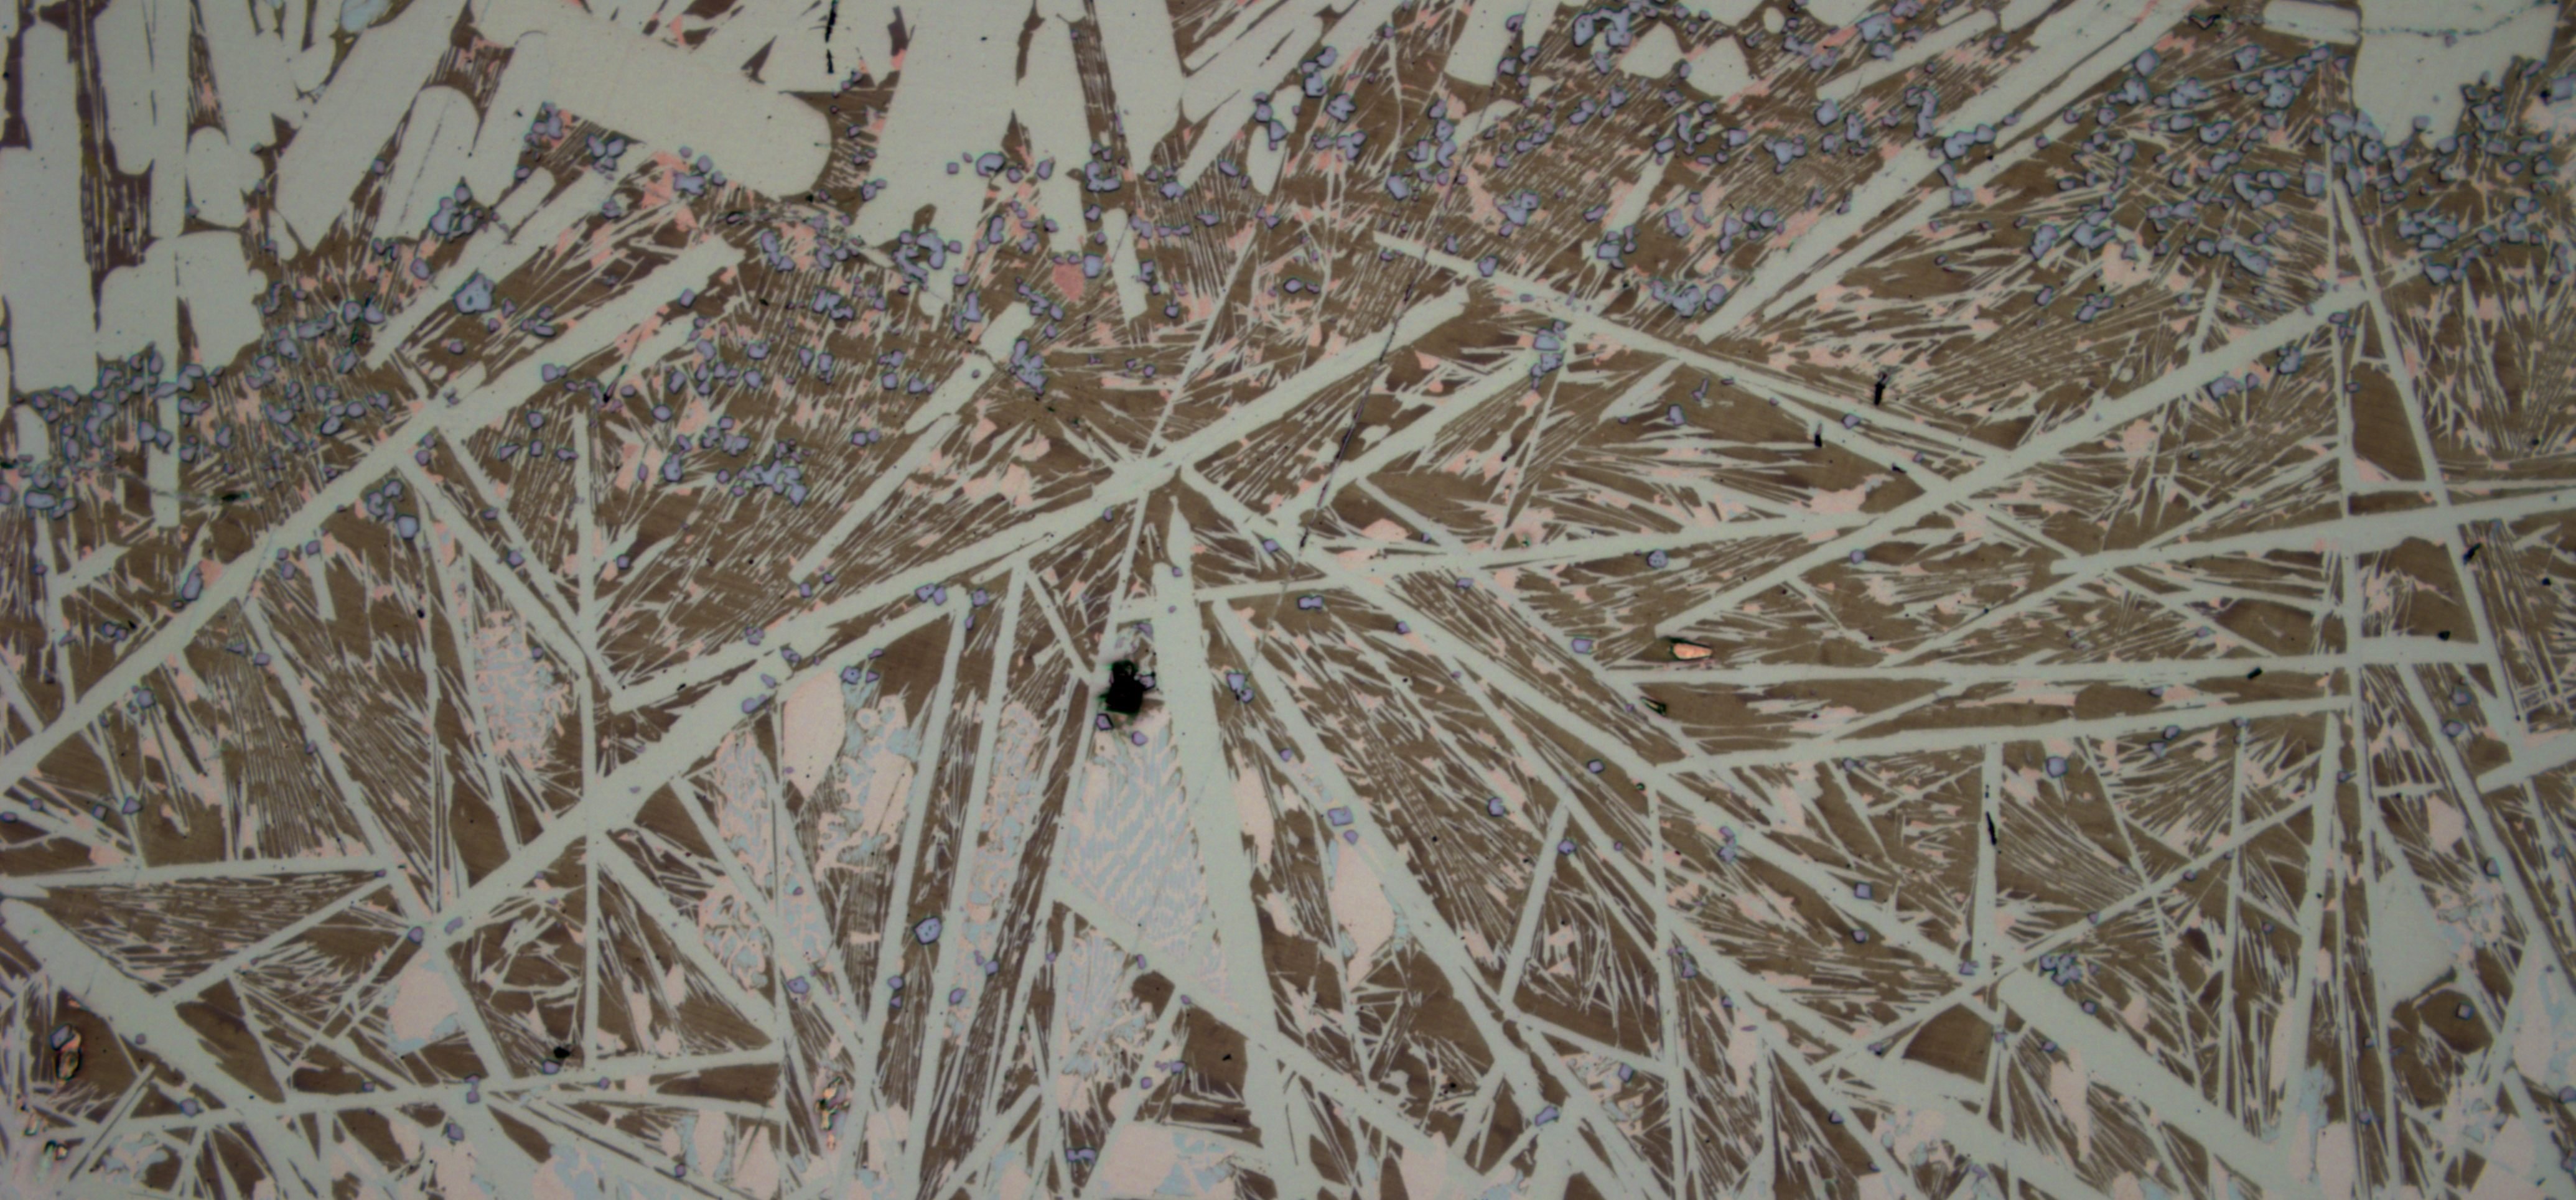
(Image: tibra; macro. — Nature up close.)
Nature is mostly order arising from disorder.
Garbage In Useful Out Project (GIUO)
automatic programming of automatic programming
PROGRAMMERS NEEDED
I am looking for developers who are interested in helping out in writing a concise, open source application in two flavors.
Whom is it for? It is for people to play around with discovering deep patterns in their images: (1) for single images while browsing, (2) for large folders on their desktop.
Languages? For webpages: Javascript. For desktop: Pharo.
(Better Smalltalk. Very elegant!)
The basic idea is to illustrate going beyond problem posing. Often, in large projects, even if there was a way to solve for methods that solve an exactly posed problem, it's too costly even to code the problem for the system to begin to figure out how to solve and then solve. The end user must be able to be vague or wrong about what they want.
How would that work? The truth for complex systems is that it need not be difficult.
Our application is for principle illustration and popular play as a genuine game.
The images are the problem statement. The user has no EXACT idea of what problems to ask the computer to solve. Or simply does not bother. At most the user makes some parameter recommendations and solving methods are separated from problems (HEW71). But here we go one step further with the application however. What that means see below.
An image is given. The program solves the problem of figuring out what the problem is that it should be solving about the image. Given only the one image, the program figures out how to solve it, and solves it. So, the problem statement is not a question about a data set, but mere existence of a data set, the data set itself. Basically as the old joke from Babbage: if you ask a computer the wrong question, or no question at all, can it give you back something useful that you might like to know, the right answer to the right question?
Actually, yes. In many contexts, we do it all the time.
Statistical features of a complex branching system whose results are unstable and not predictable are often the same for a system of same size, and further, varies with size along a straight line as for example according to HUB04.
However, they involve counting specific features at a high level, such as termini and branch points in a resulting pattern. A statistical machine learning will not detect them. Rather the user works together with the program and gives vague hints and effectively program vaguely. This point should be evident and clear to the user.
The same when predicting behavior of complex systems such as organisms. Plainest example: we can neither define nor predict had we defined, in physical detail, the cat as a physical system. But if we pick the right category, here distance from distinct types of objects, we find that the cat moves nearer to milk and away from other things. Great, we can say the cat "wants" milk. And it really does "want" milk. It's behavior is real. This motion is just a summary or proper part of its full behavior, so no less real. (ADA29)
I suggest the application is educational besides entertaining. What it would illustrate is the structure of simple programs which can do a lot of work of noticing higher level patterns if they focus on meaning, summaries of data, not data. I want the source code to be very concise and display before the program runs to make this message.
Summary
The most common user in the near future often:
(i) doesn't know exactly what he wants a machine to compute, or
(ii) doesn't know how to write exact instructions which communicate to it exactly what he wants it to compute, even if he doesn't have to exactly instruct it how to compute that, or
(iii) doesn't have the resources to write any exact instructions anyway.
Constructing exact instructions often consumes more resources than the user has. Why?
Because the user:
(a) solves a problem that is sufficiently complicated or complex, or
(b) is a person who is not sufficiently skilled, or is another machine which operates with incompatible exact syntax,
(c) asks one question only to use the answer in order to decide which questions to ask next, so no single question, and no sufficiently long chain of questions, is worth more than the cost of writing such instructions.
Housekeeping
To avoid getting stuck looking for patterns unlikely to be found by it, or simply unlikely to be present, instead of searching data it samples it, runs only a few tests of any single type. All its tests are randomly generated. Concurrency helps the program run faster, simplifies the algorithm, and allows the user to see results of some images while others are being processed.
What's Involved Specifically
Pixel coordinate extraction, discarding repetitions in trees, user interface buttons, permutations, and counting, and matching counts.
Most complexity would come from the actual program having more methods and deciding which methods to use based on success or failure of previous methods tried. For example, it might switch to thick crosses, instead of boxes, etc, if the user re-ran the program on the same images where it found no patterns.
A graphical statistics demo program P.
A user selects and inputs a folder with some images λ_1 , ..., λ_Z to P.
They then press a button: SHOW.
P attempts to draw and display other images λ^x_1 , ..., λ^o_Z . Test images follow.
Problem (an input)
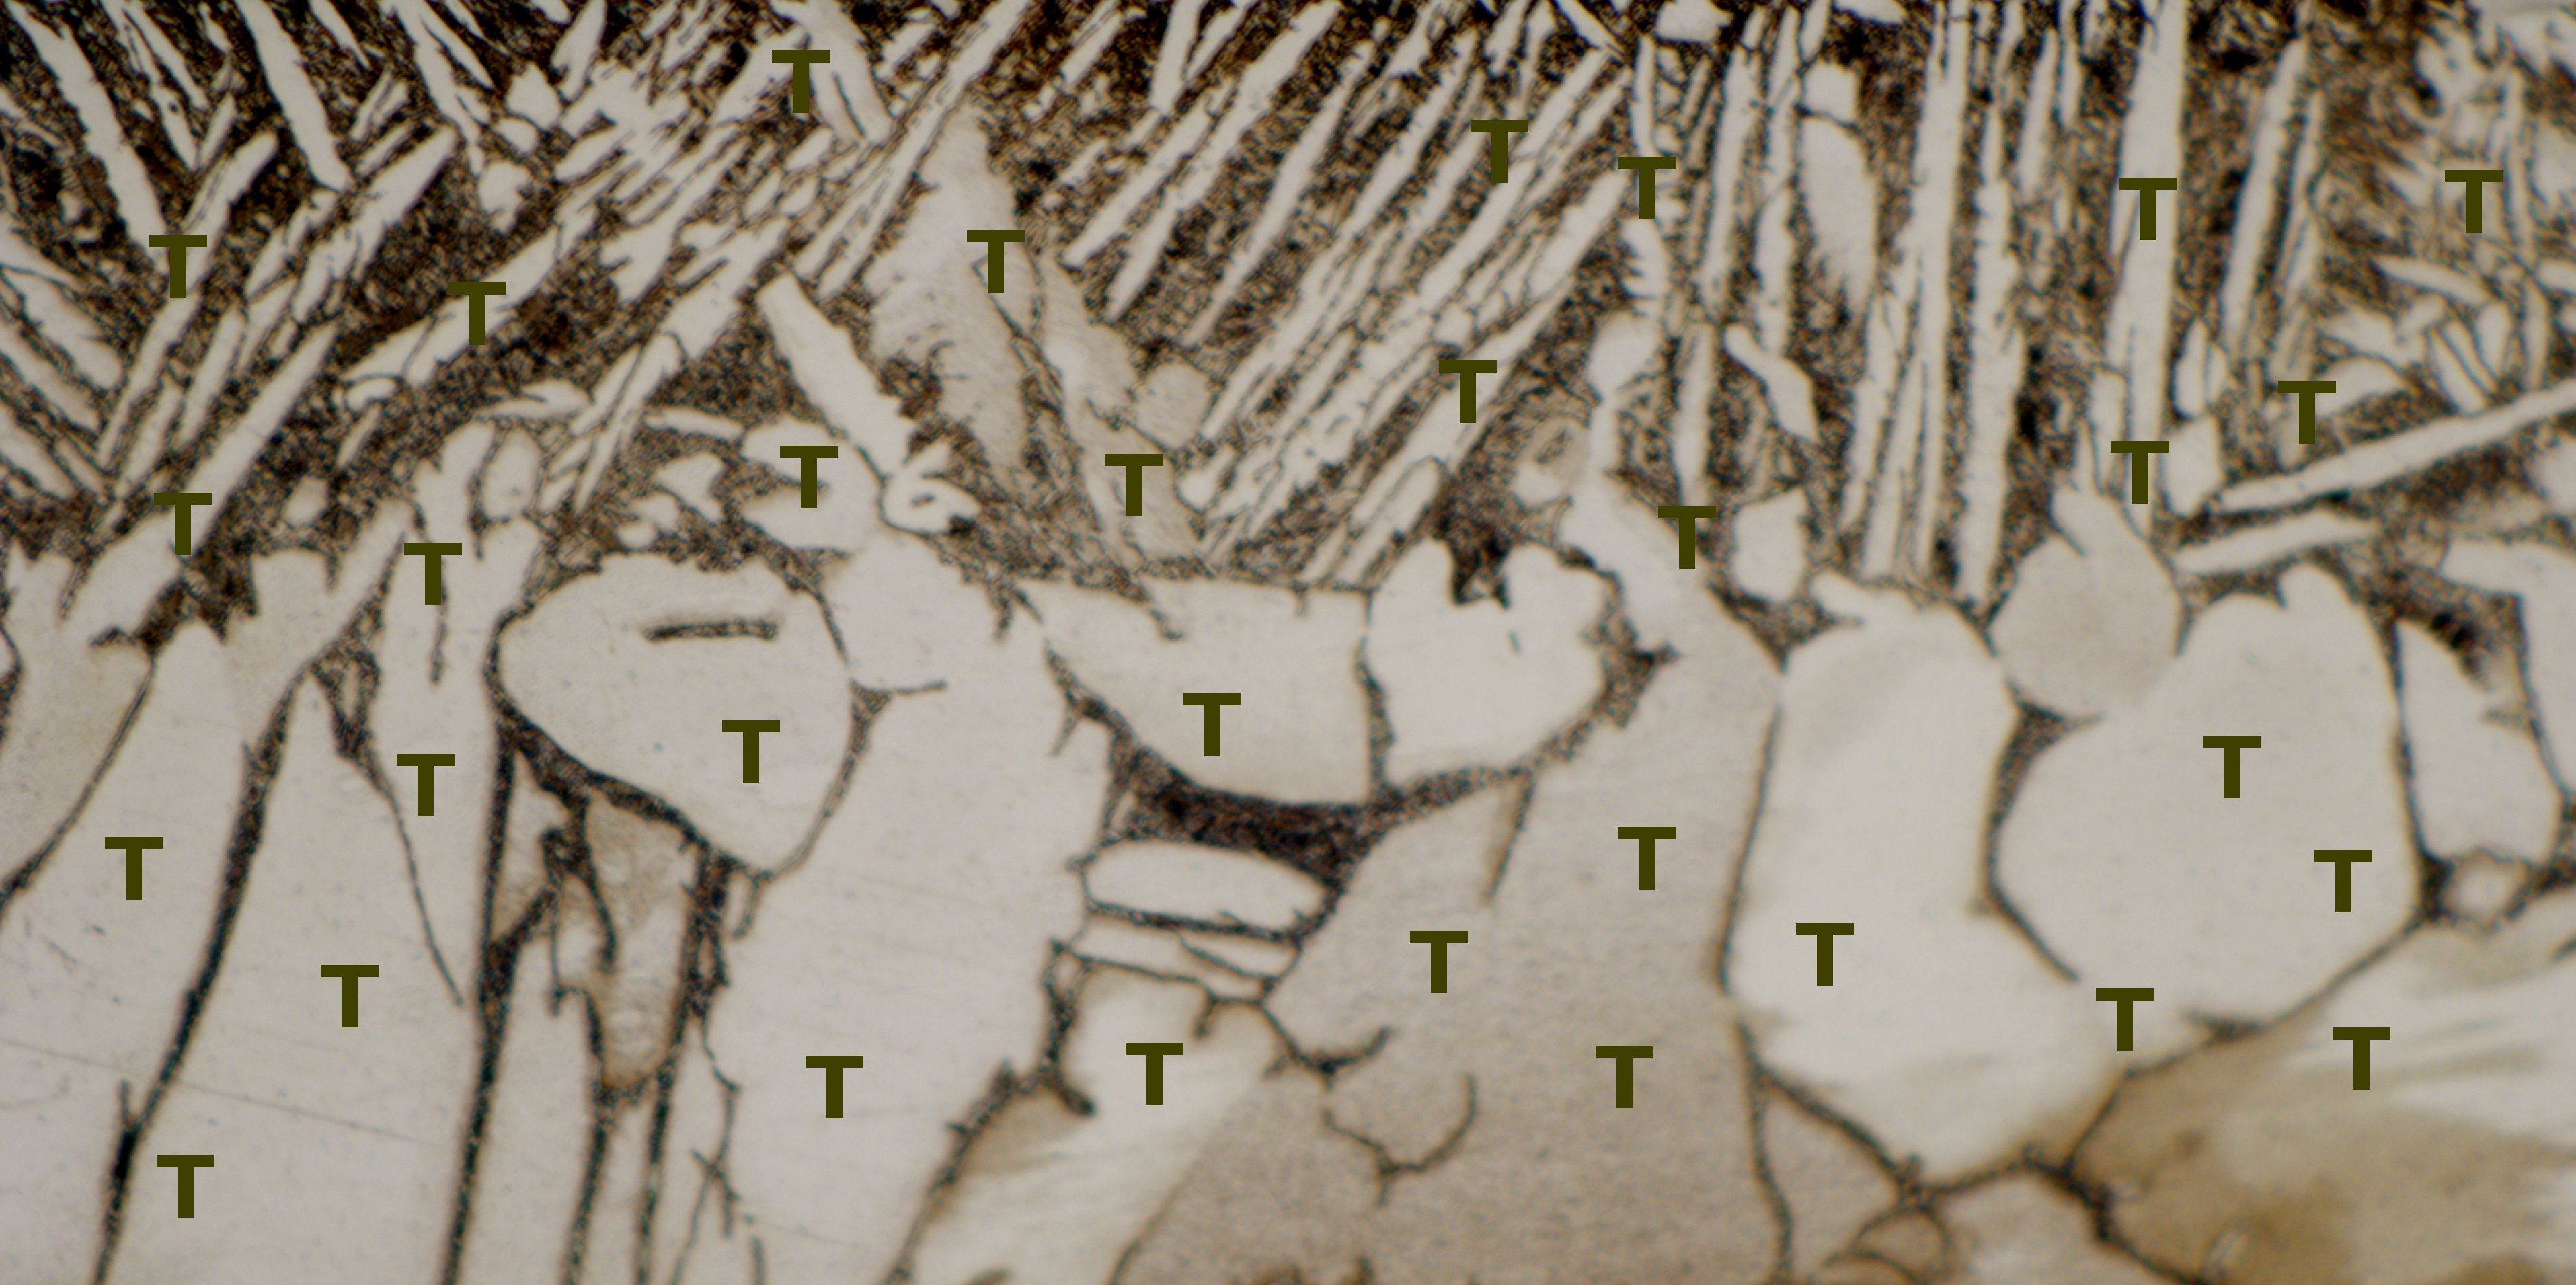
Solution (an output)
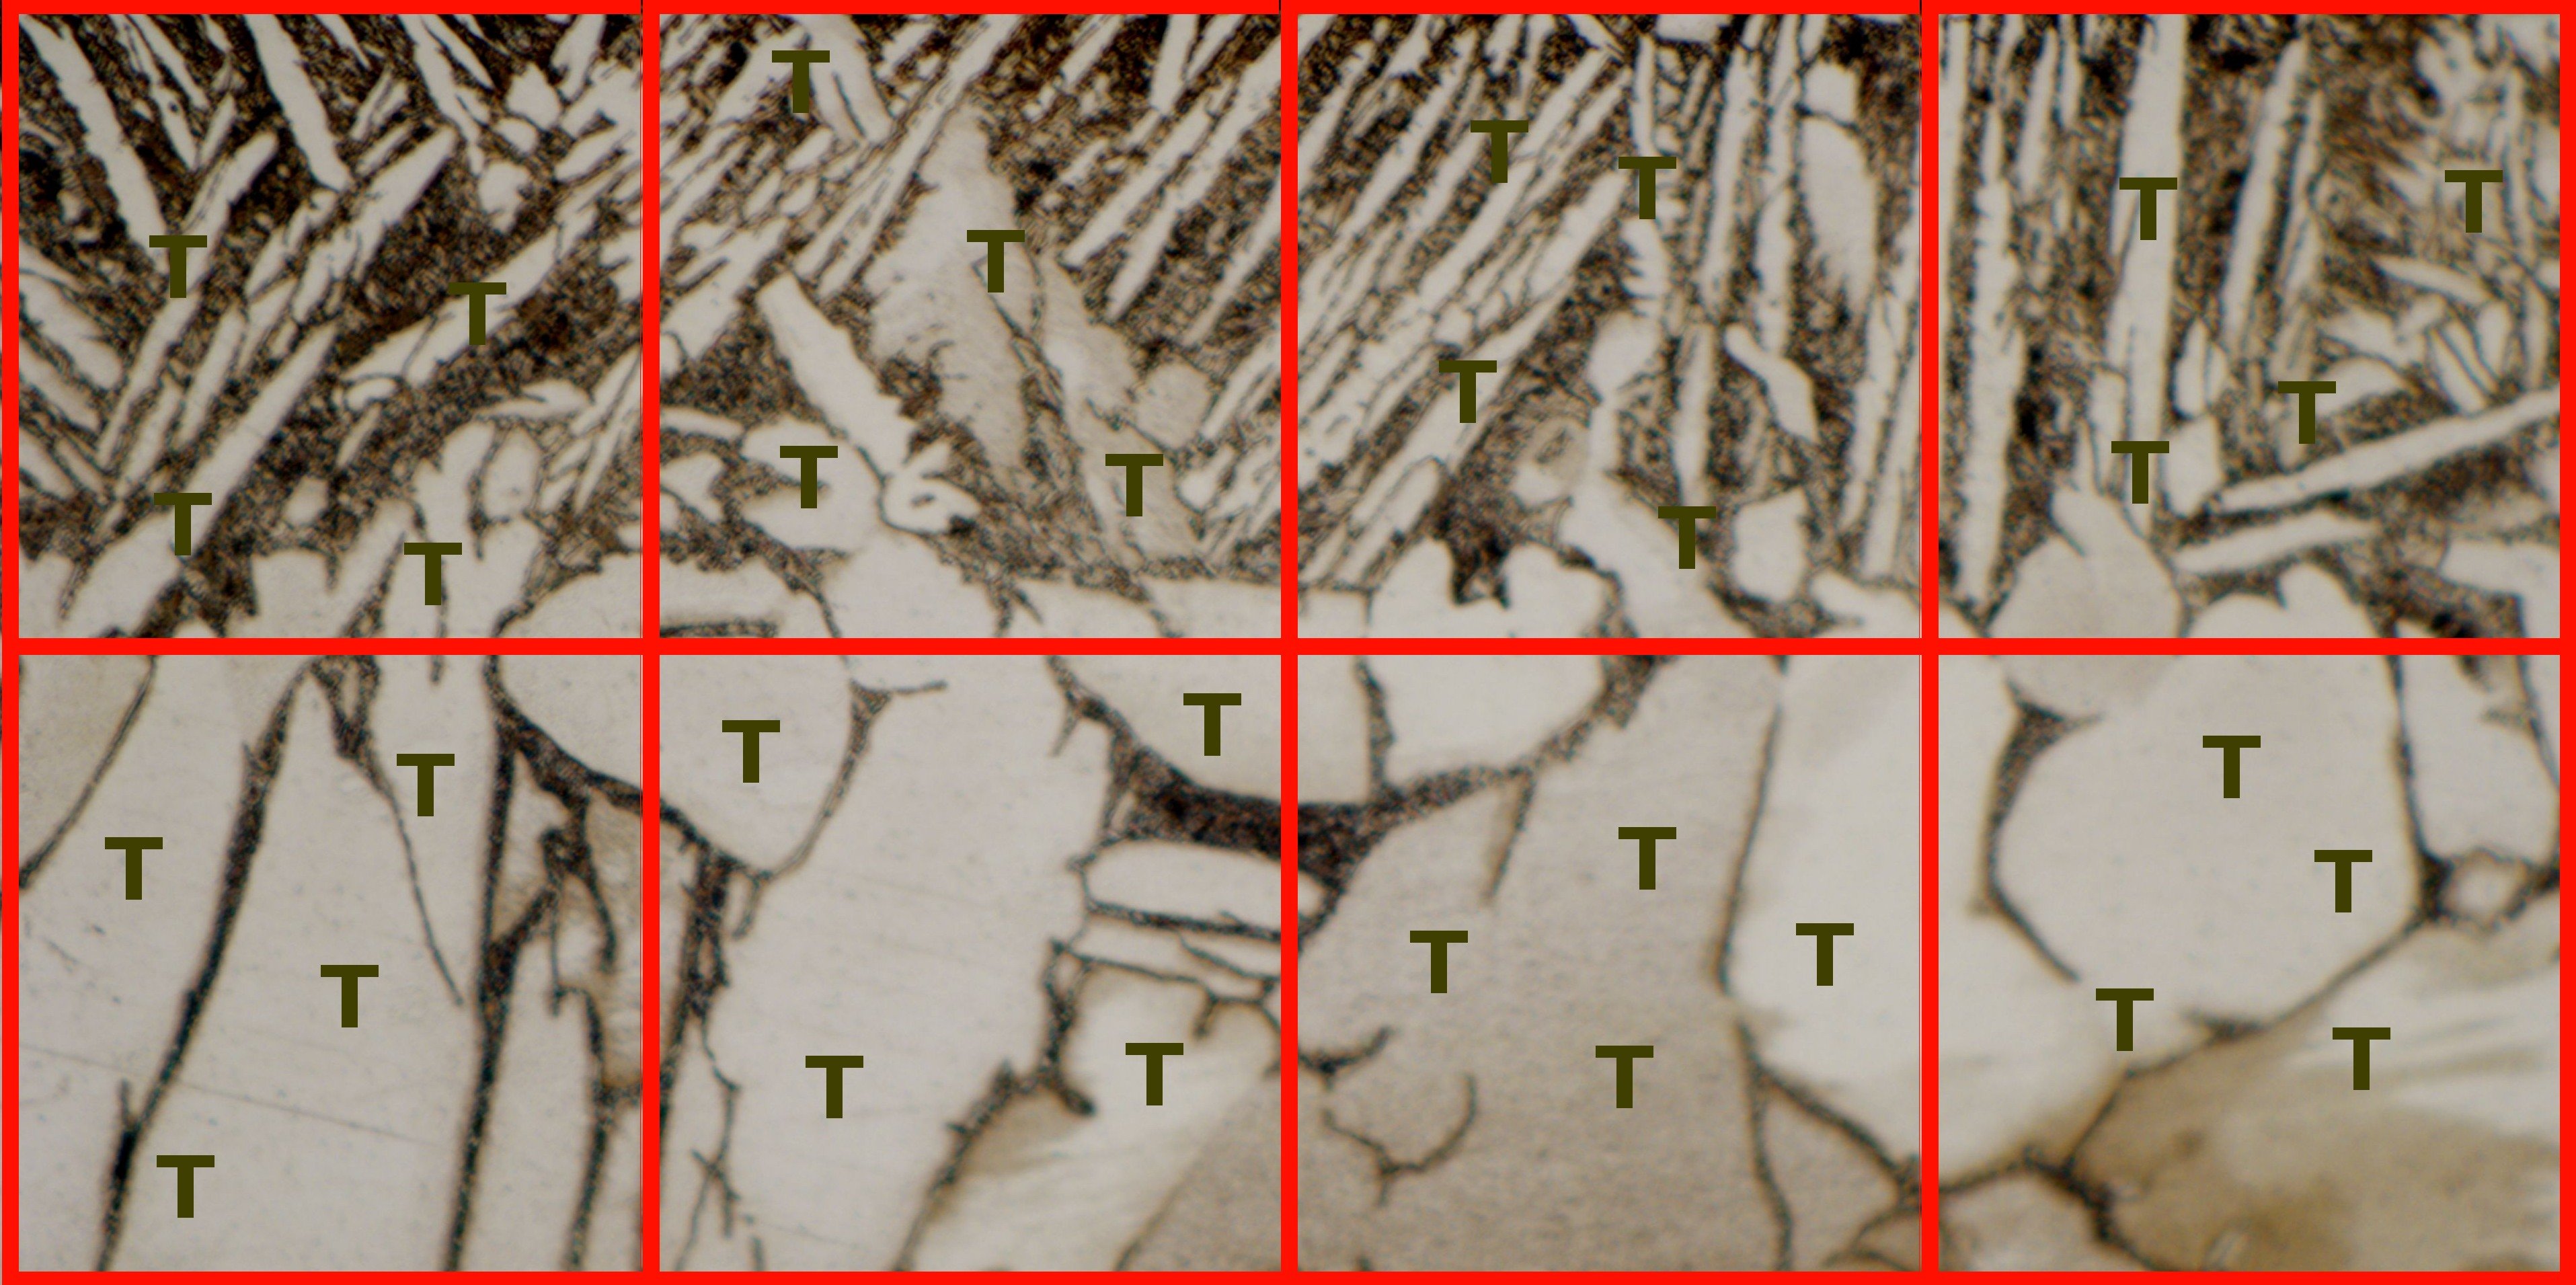
The red perimeter grid cells above each have exactly four same color T signs. In the context of P , a problem statement that P comprehends is an image I a user inputs to P . A solution then to this problem is another image O.
That image has a grid printed on it — which outlines the parts of I that all have something in common statistically. A user does not specifically expect anything; sometimes there is no solution. In that case, NOTHING TO SHOW pops up in a field in the program below the button SHOW.
Observe that there are really four possible alternative solutions in the example above, because dividing the image into top half and bottom half, or left half and right half, or into quarters horizontally, also works. All equally mark cells with the same number of T signs of the same color.
So, to avoid indeterminism, the first valid grid found is displayed and the program sets to work on the next image in the folder. This always terminates, because grids are randomly selected and tested one at a time.
The program opens. There will be a field for the user to select a folder with Z many image files. The user then clicks a button. A field ATTEMPTS exists, for the user to enter an integer N ; suppose N = 8. The program:
- Extracts and stores the size S(I_i ) type (width, height) of the image I_i .
- Randomly selects per image one method M_i [ ] from a small finite list:
M_i [ ] ∈ { A[ ], B[ ], C[ ], ... }. - Selects at random Z · N grid cell sizes G_ij and stores them such that S(I_i )/4 < G_ij < S(I_i )/32, i ∈ 1, .., Z, j ∈ 1, .., N .
- Creates the Z · N objects labeled M_i [ G_ij ], i ∈ 1, .., Z, j ∈ 1, .., N . Each one has its own thread.
- Sends the images to correspondingly stamped objects. The result is: the Z · N concurrent tasks I_i .M_i [ G_ij ] = “M_i [ G_ij ] ( I_i )”, i ∈ 1, .., Z, j ∈ 1, .., N .
These are method instances. Each method has different integer parameters V_M , W_M ; suppose they are (32,8), (16,8), (16,32), for A[ ], B[ ], C[ ].
The object M_i [G_ij] (I_i ):
Superposes a grid X on the image I_i . It does not display this.
1.1 X has cells mesh size G_ij .
1.2 X starts in the top left corner; cells are tiled down and right.
1.3 X has at least two cells.
1.4 X stretches to fit if one more cell would make it larger than I_i .Counts pixels with the 〈same〉 color in each cell. This is done thus:
2.1 The colors are (red,green,blue) coordinate points (each 0 to 255 units) it encounters scanning left to right and top to bottom in each cell of the grid.
2.2 It extracts and lists the pixel (x,y) position coordinate points having identical color coordinates. This results in a tree: a color and its list of many points. As many trees as cells; as many lists per cell as color per cell.
2.3 It slightly reduces the number of colors it considers. Those color coordinates in each tree whose three color coordinates do not differ by more than V_M units have their corresponding lists of pixels position coordinates merged. And those lists merged have their headings, the color coordinates,
merged to form a list, too, instead of being single points. There is now, per cell, a list whose entries are lists of colors and each list of colors is paired to a list of pixels. So trees get wider and shorter while branches lengthen.
2.4 It drastically reduces the number of pixels it considers. Those pixels in each list whose two position coordinates differ by more than W_M from all others are removed from that list. And pixels in each list whose two position coordinates do not differ by more than W_M units have all but one pair of
coordinate discarded from the list. So branches shorten.
2.5 It counts and stores the number of items in each list. There are as many lists as colors. So it measures the length of branches.Checks if any numbers that result from this counting are the same for all cells in the grid. This is True or False.
3.1 If this is False it deletes the object. That object does not send anything to the program to display back to the user. Also: this reduces the counter which counts the number of objects by 1.
3.2 If this is True — then for each the list of pixels where the number of items is identical in each cell — it checks if at least one of the colors in the list paired to this list has color coordinates that do not differ by more than V_M units from the color coordinates of at least one of the colors associated to such lists in adjacent cells. This is True or False.
3.3 If this, too, is True for all cells, the object superposes the gridlines in red, several pixels thick, on a copy of the original image that the user input, and sends this new image back to the program, which displays the result of this operation in a new window. Also: this reduces the counter which counts the number of objects by 1.
3.4 When the count of objects is null, the user is prompted to select another folder or retry this folder (others methods or grids could be tested).
The user can close this prompt and display windows, if any, the program opened.
3.5 The program halts and waits for user input.
The fun part. The user can drag and drop images with other forms of grid. Various shapes, blobs, possibly several dimensions, operating on copies or transforms. There can be other methods added. Each method is its own actor. This is easy to do in Pharo. A goal is to make it easy for users to add their own methods.
REFERENCES
ADAMS, Donald, 1929, 1, Experimental Studies of Adaptive Behavior in Cats, Comparative Psychology Monographs, 6, 1:1--168 (ADA29)
HEWITT, Carl, 1971, Procedural Embedding of Knowledge in Planner, Proceedings of the International Joint Conference on Artificial Intelligence, Los Altos, Kaufmann (HEW71)
JUN, Joseph, HUEBLER, Alfred, 2004, 8, Formation and Structure of Ramified Charge Transportation Networks in an Electromechanical System, Proceedings of the National Academy of Sciences of the United States of America, 102, 3:536--540 (HUB04)
Posted on Utopian.io - Rewarding Open Source Contributors