Thank You For Your Support and For Honoring Me With Your Up Vote...

As a reminder the course is aimed for complete beginners.
I tried to keep the lessons short and to the point giving out clear examples
and videos where required.
Lesson 16. Forex Bar Charts :
Using Bar Charts is one way of studying and analyzing charts.
In this tutorial we will go though the basics of bar chart patterns and how they are used.

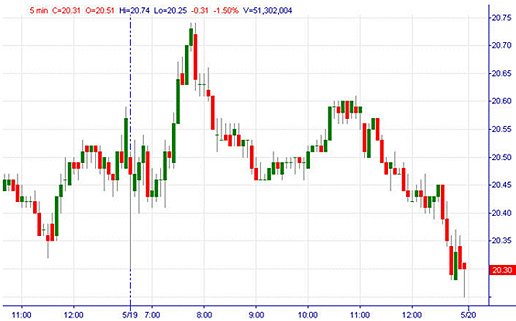
You may display the charts in bars where all price action information for that period is displayed in just 1 bar.
For example for 5 minute charts, every bar on the chart represents 5 minute period for that trading session.
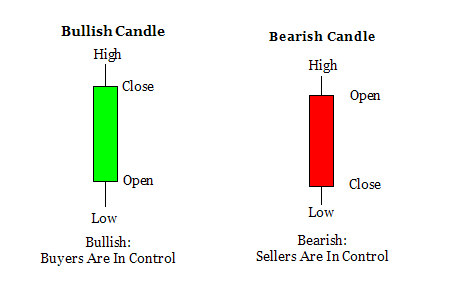
The price at the top of the bar represents the high at that 5 minute period.
The price at the bottom of the bar represents the low at that 5 minute period.
The small horizontal line (-) at the left of the bar, represents the open price at that 5 minute period.
The small horizontal line (-) at the right of the bar, represents the close price at that 5 minute period.
Similarly if you switch the chart to 1 minute, every bar represents the price action for that 1 minute period with the high, low, open and close prices. This is the same for all currency pairs.
Also if you switch the chart to 1 hour, every bar represents the price action for that 1 hour period with the high, low, open and close prices. This is the same for all currency pairs.
Last but not least if you switch the chart to 1 day, every bar represents the price action for that 1 day period with the high, low, open and close prices. This is the same for all currency pairs.
So which time frame to use? It depends on your trading style. Being a scalper you will definitely use 1, 5 or 15minute charts. Being a intraday trader, you will probably use 1 hr, 4hr and 1 day (yes to draw trend lines), and for day traders you will definitely use 1 day or more time frames.

Bar Colours:
If the session for the period closes higher than the open, normally in most trading platforms is shown in green, because the price for that period went up.
If the session for the period closes lower than the open, normally in most trading platforms is shown in red, because the price for that period went down
If the session for the period both the open price and the close price are equal, it indicates that the price did not went up or down for that period and it shows indecision during that period. .

Every comment, every upvote, every support is really appreciated.
Thanks For Reading,
@lordoftruth
If you missed to read my
previous posts from the series of Forex Education Center
You will find it in the down list:
