
Posts in this series: Part 1 / Part 2 / Part 3 / Part 4
Last week I started building a small tool that will take a list of users, and display a ranking of who powered up the most STEEM within a specified time period. Last night I got a first draft of the complete tool done! It isn’t working when I put in a large list of users, but the general feature set is working.
Specifying a Range of Transactions
The first order of business was providing a way to tally power ups within a specific date range. I added this to my totalPowerUps function:
function totalPowerUps(data, startDate, endDate) {
    let total = 0;
    let startDateObj = new Date(startDate);
    let endDateObj = new Date(endDate);
    let dataStartDate = new Date(data[0][1].timestamp);

    if (dataStartDate > startDateObj) return 'need more transactions';

    for (let i = 0; i < data.length; i++) {
        if (data[i][1].op[0] === 'transfer_to_vesting') {
            let transferDate = new Date(data[i][1].timestamp);
            let transferString = data[i][1].op[1].amount;
            if (transferDate >= startDateObj && transferDate <= endDateObj) {
                total += Number(transferString.substr(0, transferString.indexOf(' ')));
            }
        }
      }

  return total
}
The function now takes a start and end date in addition to the data to total. I realized going into this that I don’t have a ton of experience with dates in JavaScript, but overall it wasn’t too difficult to get the range to work.
Side note: something I learned is that a date object in JavaScript is the milliseconds since midnight January 1, 1970, UTC. I’ve seen dates represented as huge integers in the past and didn’t realize this is what the number meant. As an example, check out this code:
var start = new Date('December 17, 1995 03:24:00');
var end = Date.now();
var elapsed = end - start;
console.log(elapsed);
This logs out 697654340003 which was the number of milliseconds between December 17, 1995 at 3:24 and when I ran the code.
So in my function I pull in the start and end dates and confirm that they’re represented as JavaScript date objects. Then I do a quick check to make sure I have enough transactions with if (dataStartDate > startDateObj) return 'need more transactions';
For some background of why this is necessary, the app pulls in a large slice of a user’s transaction history and then tallies the power ups within that slice. This if statement checks to make sure the earliest transaction I pulled for the user is before the date I want to start tallying. If it’s not, the app needs to increase the number of transactions pulled in (I’ll talk about this later).
After this check, I loop through and look for the power ups, then confirm they’re in the specified date range, and add them to the total if they are. Not as hard as I was expecting!
Creating a User Interface
![]()
The next step was to create a user interface with some HTML and JavaScript/jQuery. As I started writing this, I realized that after I implemented my front end, I eliminated the need to use Node. 🙃 So my code in this post will be based around a Node project, but after this I’ll probably get rid of the back end so I can publish it on Github Pages.
I started with a really simple form in my index.html file:
<!doctype html>
<html lang="en">
<head>
    <meta charset="UTF-8">
    <meta name="viewport" content="width=device-width, user-scalable=no, initial-scale=1.0, maximum-scale=1.0, minimum-scale=1.0">
    <meta http-equiv="X-UA-Compatible" content="ie=edge">
    <title>Steem Power Rankings</title>
</head>
<body>
    <h1>Steem Power Rankings</h1>
    <form id="search-form">
        Transactions:
        <input type="text" value="5000" class="transactions-count"><br>
        Start Date:
        <input type="date" class="start-date" value="2018-01-14"><br>
        End Date:
        <input type="date" class="end-date" value="2018-01-20"><br>
        Users:
        <input type="text" value="jeffbernst,dan,ned,louisthomas,sndbox,exyle" class="users-to-search">
        <button type="submit">Search</button>
    </form>
    <br>
    <div class="results"></div>
    <script src="/node_modules/jquery/dist/jquery.min.js"></script>
    <script src="../node_modules/steem/dist/steem.min.js"></script>
    <script src="app.js"></script>
</body>
</html>
Which gives me this basic interface:

Then I created a function to pull in the input from the user, with new functions I made to execute the API calls and append the findings to the DOM:
function handleSubmitQuery() {
    $('#search-form').submit(function(event) {
        event.preventDefault();
        console.log('searching');

        const transactionsCount = $('.transactions-count').val();
        const startDate = $('.start-date').val();
        const endDate = $('.end-date').val();
        const usersToSearch = $('.users-to-search').val().split(',');

        let namePromiseArray = usersToSearch.map(name => createHistoryPromise(name, transactionsCount, startDate, endDate));

        let resultsArray = [];
        let promiseExecution = resolvePromises(namePromiseArray, usersToSearch, resultsArray);

        waitForPromisesThenAppendResults(promiseExecution, resultsArray);
    });
}

async function waitForPromisesThenAppendResults(promiseExecution, resultsArray) {
    await promiseExecution;
    let sortedResults = resultsArray.sort((a,b) => b.total - a.total);
    let resultsHtml = createResultsTable(sortedResults);
    $('.results').html(resultsHtml);
}

function createResultsTable(resultsObj) {
    let tableString = resultsObj.map((user, index) => {
        return `<tr><td>${index+1})</td><td>${user.name}</td><td>${user.total}</td></tr>`
    }).join('');
    let resultsHtmlString = `<table>${tableString}</table>`
    return resultsHtmlString;
}
I think I might have gotten a little promise happy after my lesson with my mentor this week, but it was cool to be able to write some new asynchronous functions on my own to finish up this project.
I’m excited to start using React, because from my small amount of experience with it, I know that moving around and combining small pieces of html will be a little easier with JSX. At least I hope it will, because it feels kind of clunky doing all of this in strings.
With the new functions and some jQuery to let the user interact, the app is almost done! I can do a search and display a ranking of power ups for the users. It looks like this:
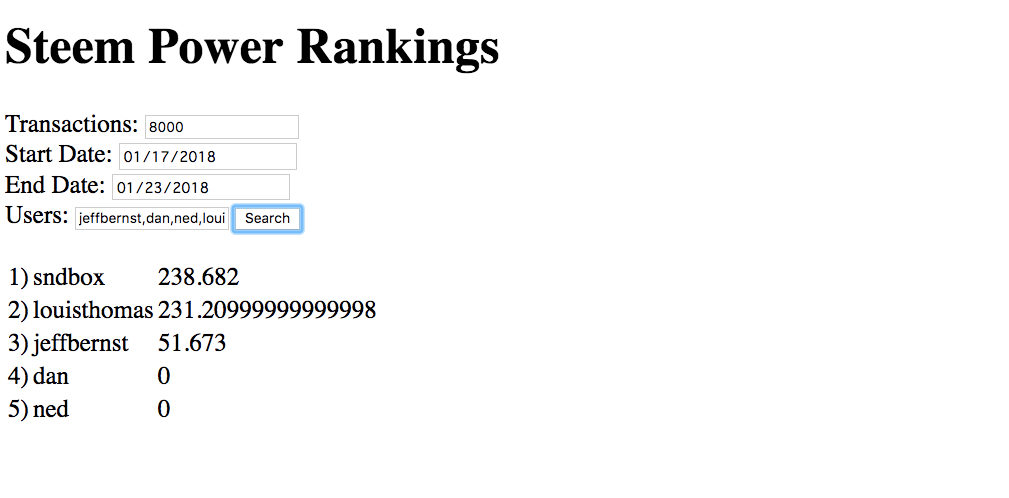
It seems to work with up to around 30 users, but after that it gets hung up and won’t return anything.
Final Steps
From here I just need to do some troubleshooting and figure out how to make this app usable with a bigger set of users.
I started setting up a tool called Wallaby to try out test-driven development before finishing up this draft of the project, but I ended up just jumping into the code to finish it up more quickly. It’s something I really want to start getting more practice with though because it seems like it’ll make me a better coder. I’m planning on writing about how I use it with my Thinkful capstone project.
This might be the last post I write for this small tool, which marks my first adventure with coding something using the STEEM blockchain. Here’s the GitHub repo in case you’d like to check out the code.
I’m excited I gave this a shot because it gave me some more confidence to try to convert my first full-stack JavaScript project into a STEEM app.
I hope writing out code reviews of my projects will be useful for some people out there who are looking to do similar things. If you have any comments or suggestions please let me know in the comments!
Thanks you so much for reading. 🙂
Posts in this series: Part 1 / Part 2 / Part 3 / Part 4