Thank You For Your Support and For Honoring Me With Your Up Vote...

As a reminder the course is aimed for complete beginners.
I tried to keep the lessons short and to the point giving out clear examples
and videos where required.
Lesson 17. Candlesticks Charts :
Candle sticks charts are more popular than the Bar Charts and there are a lot of studies about the candlesticks patterns
like for example patterns that may indicate trend reversal.
In this tutorial we will go though the basics of candlesticks patterns and how they are used.
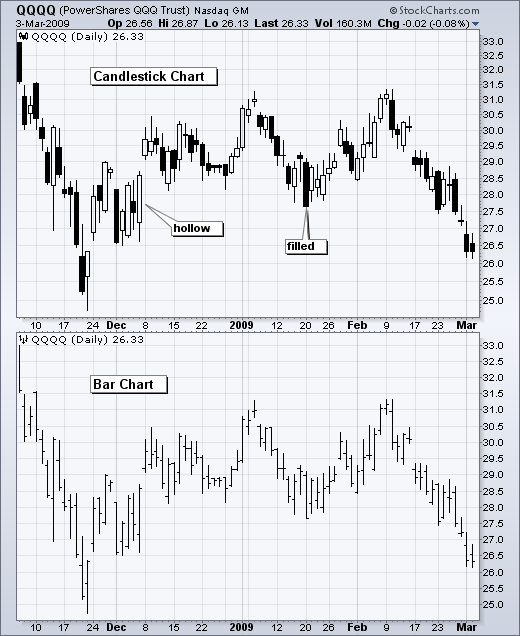
Candlestick charts are very popular among traders. Similarly to a bar chart, every candlestick on the chart represents all price action information for that period.
For example for 5 minute charts, every candlestick on the chart represents 5 minute period for that trading session.
The price at the tips normally called the wicks or shadows represent the high and the low at that 5 minute period, like the bar chart.
The body of the candlestick represent the open and close of that period.
If the open price is greater than the close price it is normally shown in greenIf the open price is less than the close price it is normally shown in red.
If the open price is equal to the close price it is very important candlestick pattern called the doji.
This indicates indecision in the market and a good indication for price reversal.
We will explain chart patterns in our advanced technical analysis course.
Similarly if you switch the chart to 1 minute, every candlestick represents the price action for that 1 minute period with the high, low, open and close prices. This is the same for all currency pairs.
Also if you switch the chart to 1 hour, every candlestick represents the price action for that 1 hour period with the high, low, open and close prices. This is the same for all currency pairs.
Last but not least if you switch the chart to 1 day, every candlestick represents the price action for that 1 day period with the high, low, open and close prices. This is the same for all currency pairs.
Similar to bar charts, which time frame to use depends on your trading style. Being a scalper you will definitely use 1, 5 or 15minute charts. Being a intraday trader, you will probably use 1 hr, 4hr and 1 day (yes to draw trend lines), and for day traders you will definitely use 1 day or more time frames.

Every comment, every upvote, every support is really appreciated.
Thanks For Reading,
@lordoftruth
If you missed to read my
previous posts from the series of Forex Education Center
You will find it in the down list: