
I have modeled the STEEM price scientifically, then forecasted it, and the results were shocking!
I don't use technical analysis to predict prices because it's pretty unreliable, and I have yet to find a scientific research that have proven it's accuracy over long term. I might use technical analysis sometimes for illustrative purposes, but if we want to be serious we need to use real mathematical tools.
I use Quantitative Analysis and Econometrical tools to model financial markets, just like any Ph.D. Quant professional on Wallstreet.
I have demonstrated the usefulness of quant models in my previous articles:
- @profitgenerator/let-s-calculate-the-probability-of-bitcoin-going-to-1000usd-and-above-pt-1
- @profitgenerator/let-s-calculate-the-probability-of-bitcoin-going-to-1000usd-and-above-pt-2
- @profitgenerator/scientific-forecasting-of-sbd-volume
In this article I will forecast the STEEM price about 42 days in the future, and the results will be pretty dramatic.
Modeling STEEM
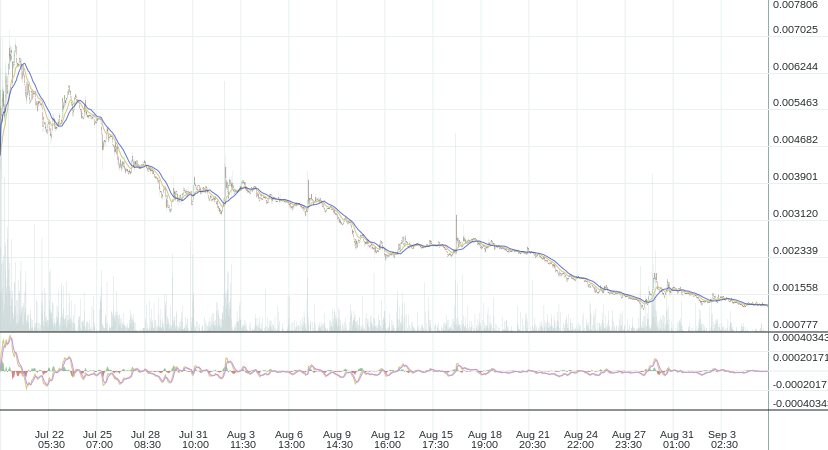
I have downloaded the STEEM_BTC price from Poloniex with their API system, by calling:
https://poloniex.com/public?command=returnChartData¤cyPair=BTC_STEEM&start=1&end=9999999999&period=900It is price data in 15 minute timeframe (lower timeframes have too much data, and high signal to noise ratio, and in some cases many null values, that distort stats severely, so I have chosen 15 minute). We have 4625 elements, until yesterday, spanning from
Tue Jul 19 04:15:00 2016 UTCtoMon Sep 05 08:15:00 2016 UTC.I have used the good old
ARIMAmodel to model the price, and we will achieve very low statistical error numbers.I converted the
JSONfile intoCSVso we can work easily with the data.
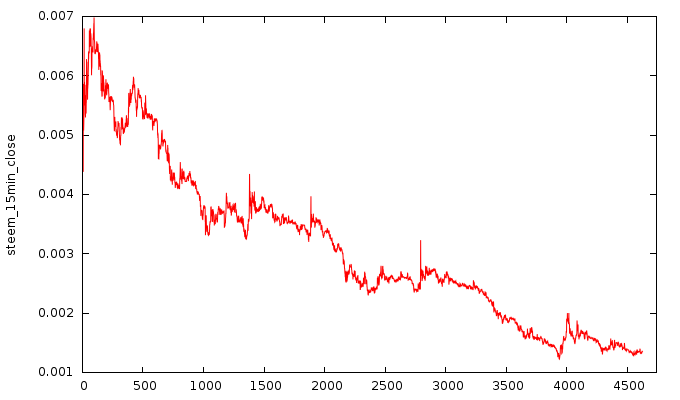
- We look for a trend, which is obvious that there is one, if we just look at the chart, but we use objective tools to measure it, like unit root tests:
Augmented Dickey–Fuller Test:
| type | asymptotic p-value | model |
|---|---|---|
| with constant | 0.5833 | (1-L)y = b0 + (a-1)*y(-1) + ... + e |
| with constant and trend | 0.2408 | (1-L)y = b0 + b1*t + (a-1)*y(-1) + ... + e |
| with constant and quadratic trend | 0.135 | (1-L)y = b0 + b1*t + b2*t^2 + (a-1)*y(-1) + ... + e |
We observe that we have a constant at least and probably a trend , so we will need to differentiate having a d>0 in the ARIMA(p,d,q) model.
Kwiatkowski–Phillips–Schmidt–Shin Test:
T = 4625
Lag parameter = 70
Test statistic = 0.765265
P-value < .01
The KPSS test has an inverse null hypothesis so a p<0.01 also confirms that we need to differentiate.
- Then we look for the
pandqvalues with a Partial autocorrelation function
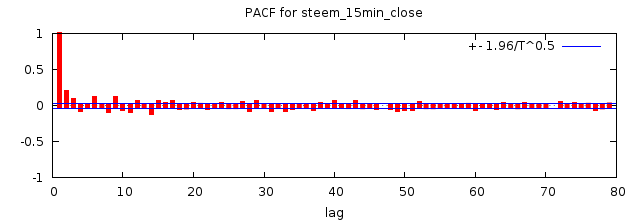
We observe that the p and q values will probably be between 0 and 1. But I have tested all possible combinations from 0 to 4.
- Then I went through all combinations from 0 to 4, an surprisingly the best model is
ARIMA(0,1,0)orI(1), technically we just have a constant and a differentiation of it.
Constant coefficient: −6.79381e-07
Constant standard error: 9.27125e-07 (very accurate)
- According to Wikipedia an
ARIMA(0,1,0)with a constant resembles:
An ARIMA(0,1,0) with a constant, given by
— which is a random walk with drift.
- The model fits perfectly (I have made 1 line wider to be more visible):
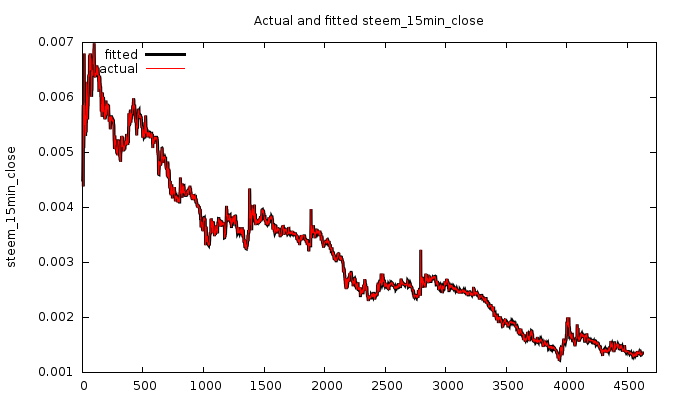
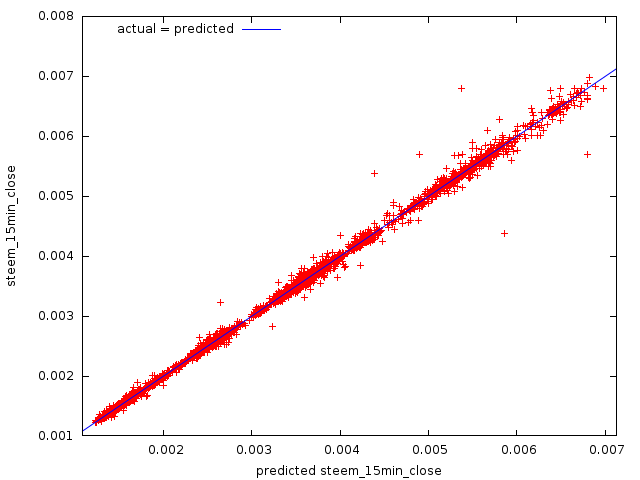
- The actual vs predicted chart shows that they are aligned very well, with a few exceptions:
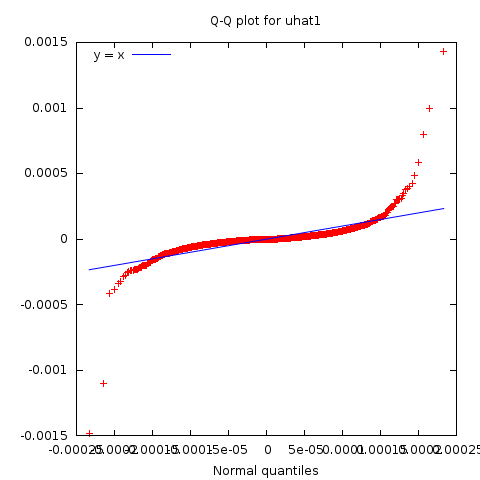
QQ Plot:
Forecasting STEEM
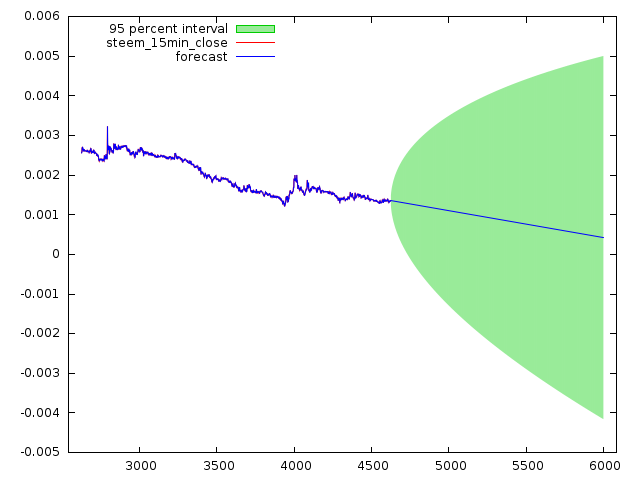
I have forecasted the STEEM_BTC price to 4000 units in the future, which for 15 minute chart means 41.6(6) days.
So if our last data unit is Mon Sep 05 08:15:00 2016 UTC this means that our forecast will last until Mon Oct 17 00:15:00 2016 UTC.
The error numbers are ultra low (for the actual data of course), so this means that our forecast data should be very accurate:
| Error | Number |
|---|---|
| Mean Error | -1.0082e-20 |
| Mean Squared Error | 3.9738e-09 |
| Root Mean Squared Error | 6.3038e-05 |
| Mean Absolute Error | 2.9055e-05 |
| Mean Percentage Error | -0.012379 |
| Mean Absolute Percentage Error | 0.91349 |
And since the price can't go below zero perhaps a more correct chart would look like this:
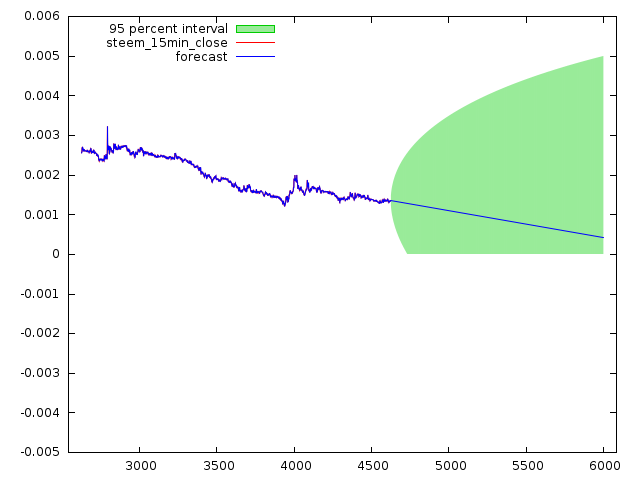
Where the area below the line has an equal probability of happening with the area above the line. So the price should be inside the green area with a 95% probability.
We also observe that it's very unlikely that the price will go above 0.005 BTC, with the probability of <2.5% of that happening in the next 41 days.
This means that the STEEM price at Oct 17th should be :
0.00043 BTC
Last price is 0.00131450 BTC, so this would be a -67.28% drop in the next 41 days!!
So given that our model is pretty accurate with an absolute error of only 0.000029055 from the mean, I think we have some problems.
I don't want to scaremonger here, and I could be wrong, but if I am not, then we have a problem, and the community has to do something about it. I hope @dan and @ned is already aware of the instability of STEEM and are looking for solutions to stabilize STEEM.
The market cap has already went down a huge amount so a further decrease is not unlikely. We as a community need to do something about it, to make STEEM stronger and more trusted.
I will write my next article about how to stabilize the STEEM price and ideas for long term growth. Stay tuned!
Disclaimer: The information provided on this page might be incorrect. I am not responsible if you lose money using the information on this page! This is not an investment advice, just my opinion and analysis for educational purposes.
Title Image Credit: @d3m0t3x
Chart Image Credit: https://poloniex.com