This is an analysis of the Contribution types, and approval/rejection numbers for 15th - 21st December 2017 inclusive.
Sections
General / Assumptions
Contributions Summary
Contributions by Type
Analysis and Summary
Tools used to gather data and compile report
General
@utopian-io is the open source project for open source projects, housed on the Steem Blockchain.
Currently, @utopian.io holds over 3.7 million Steem power through delegations from its kind sponsors.
To become a sponsor and view the current standings visit https://utopian.io/sponsors
This report is an analysis of the number and type of contributions sent for review, and the success/fail rate of each contribution type.
Recent reports of this type are listed here.
October 2017
November 2017 - Week 1
November 2017 - Week 2
November 2017 - Week 3
November 2017 - Week 4
December 2017 - Week 1
December 2017 - Week 2
I will aim to provide this report on a weekly basis along with a monthly summary in the final week of each month. This will allow contributors and 'employees' of utopian.io to keep in touch with how the platform is progressing with regards to approval percentages and number of Contribution types being submitted.
Assumptions
Currently, there is no indicator for 'approved' or 'rejected' contributions to utopian.io on the Steem Blockchain.
In this report, 'Approved' contributions have been voted on by @utopian-io.
'Rejected' contributions have not received a vote from @utopian-io.
1. Contributions Summary
For the second week of December 2017 - 15th - 21st inclusive, the SteemSQL DataBase holds a total of 2775 potential contributions to utopian-io. This is a huge increase on the previous weeks' total which was 1715.
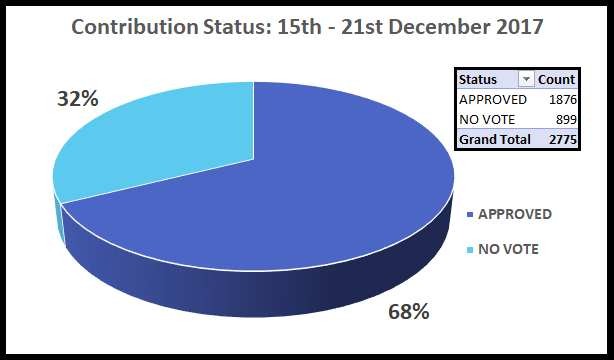
1876 of these contributions have been approved, this is almost 800 more more than the first week of December.
Despite this huge increase in contributions, the approval percentage is 68% as it was last week.
The Contributions offered can be any one of the following types:

This weeks data, split into Contribution types is shown in the pie chart below:
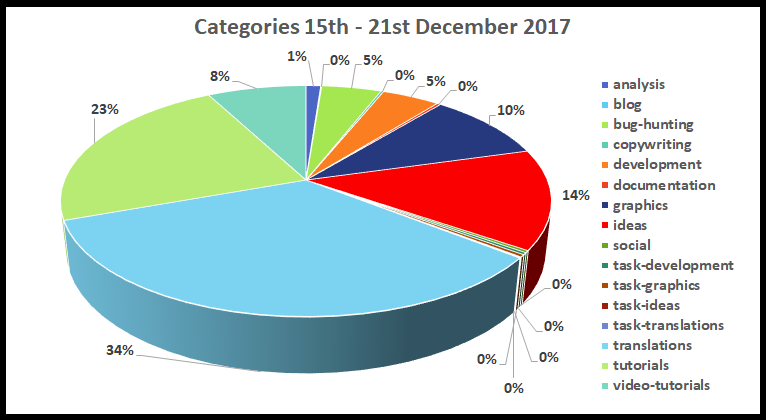
2 Contributions by Type
In this section we take a look a few of the individual contribution types of interest, present them using a pie chart.
A full list of contribution types is listed further below with associated figures and analysis.
Analysis - Approvals / Rejections
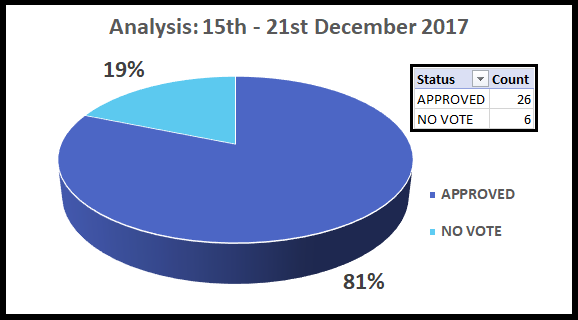
An average of just under 5 Analysis contributions a day for the third week in December totaling 32. This is 1 more than the previous week but their has been a fall in the approval percentage from 87% to 81%.
Development- Approvals / Rejections
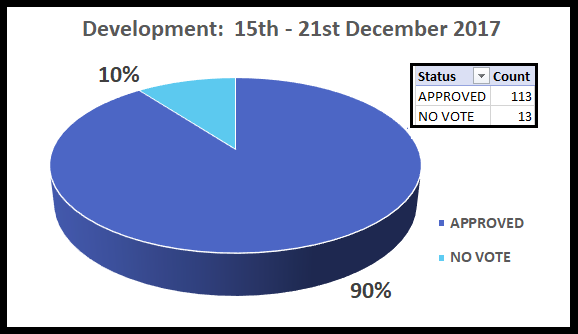
Another excellent week for the Development category with 90% of all contributions approved.
This is an increase of 11% on the previous week with 24 more contributions submitted. Considering the increase in submissions, an 11% rise in approvals is very impressive.
Tutorials - Approvals / Rejections

This week, 632 contributions were made to Tutorials category, 277 more than the previous week. A huge rise in the number of contributions for this category, and an improvement of 13% on the approval rate from the previous week.
All contribution types
The following table shows all types and totals of contributions submitted, with their approval % in the end column. Development and Analysis look to be the stand-out contribution categories of the past week, with approval percentages equal to or better than 3 out of every 4 submissions.
Not a great week for contributors submitting 'Documentation', 'Blog', and' Copywriting' with none of the these categories reaching an approval percentage over 50%.
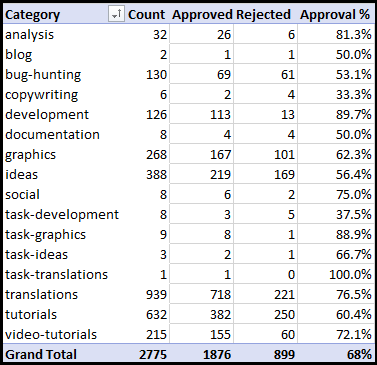
The rise in 'Translation' submissions has been explosive, and it looks like this category will be the first to top 1000 contributions in a week. When you consider that one month ago in week 3 of November, their were just over 1000 contributions across all categories, this number is huge.
3. Summary Analysis
As the weeks' pass and the data collected expands, it is possible to learn more about the developing trends in the utopian-io ecosystem.
We can already see that the number of contributions is rising impressively.
| . | NOV WK 1 | NOV WK 2 | NOV WK 3 | NOV WK 4 (10 day) | DEC WK 1 | DEC WK 2 | DEC WK 3 |
|---|---|---|---|---|---|---|---|
| Total | 360 | 655 | 1046 | 1851 | 1356 | 1715 | 2775 |
| Approved | 238 | 494 | 744 | 1067 | 843 | 1078 | 1876 |
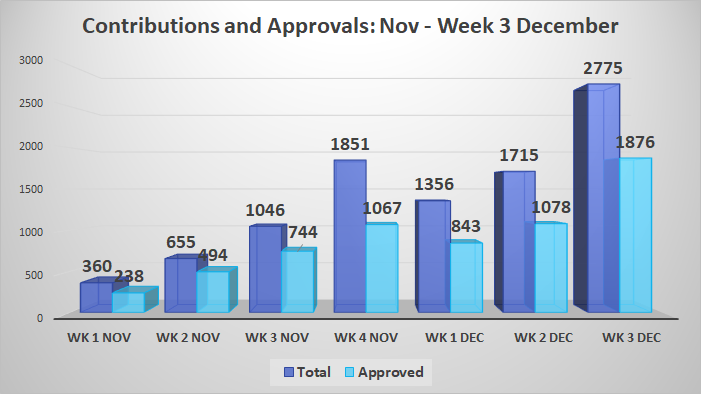
A record week for approved contributions!
The total of approved contributions reached 2543 for the month of November. And last week, I suggested that we may reach 4000 approved contributions for the month December. Looking at the data for the first three weeks of December, I suggest that we are going easily break 4000 approved submissions for the whole month.
We have an almost 80% rise in the number of approved contributions than the previous week, an percentage increase not seen since the beginning of November. This is a remarkable increase at this stage of the project, and the moderators must be working overtime to push all these submissions through.
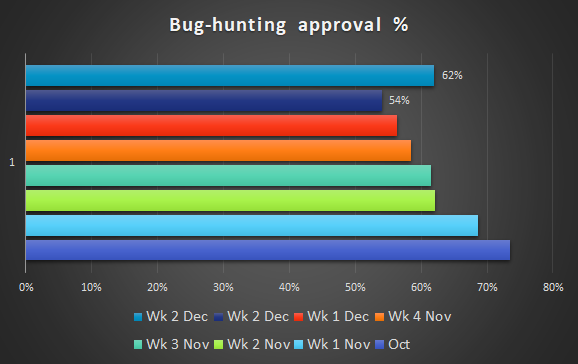
Previously I focused on the 'Bug-hunting' approval % since the beginning of the project, as it had fallen week on week. However, this week their has been a welcome rise in the submission success rate - up 8% from the previous week.
Summary
I find it difficult to believe that the number of submissions, and approved submissions can continue increasing at this rate. This is going to require a much larger team of moderators, particularly those skilled in languages.
Other categories, such as 'Analysis' have found a level of contributions each week and this looks likely to be the case in the short term as we go forward.
Congratulations to all involved in another record breaking week at utopian-io.
4. Tools used to gather this data and compile report
The data is sourced from SteemSQL - A publicly available SQL database with all the blockchain data held within (Data is normally 1/2 hours delayed from live)
The SQL queries to extra to the data have been produced in both SQL Server Personal Edition and LINQPAD 5.
An example of the Cursor used to extract the data for further processing is in this contribution
The charts used to present the data were produced using MS Excel.
This data was compiled on the 24th December 2017 at 9:00 am CET
I am part of a Steemit Business Intelligence community. We all post under the tag #bisteemit. If you have analysis you would like to be carried out on utopian-io/Steem data, please do contact me or any of the #bisteemit team and we will do our best to help you.
Thanks
Asher @abh12345
Posted on Utopian.io - Rewarding Open Source Contributors