This is an analysis of the Contribution types, and approval/rejection numbers for 5th - 11th January 2018 inclusive.
Contents
General / Assumptions
Contributions Summary
Contributions by Type
Contributions - All
Analysis and Summary
Tools used to gather data and compile report
General
@utopian-io is the open source project for open source projects, housed on the Steem Blockchain.
Currently, @utopian.io holds over 3.8 million Steem power through delegations from its kind sponsors.
To become a sponsor and view the current standings visit https://utopian.io/sponsors
This report is an analysis of the number and type of contributions sent for review, and the success/fail rate of each contribution type.
Recent reports of this type are listed here.
October 2017
November 2017 - Week 1 / November 2017 - Week 2
November 2017 - Week 3 / November 2017 - Week 4
December 2017 - Week 1 / December 2017 - Week 2
December 2017 - Week 3 / December 2017 - Week 4
January 2018 - Week 1
I will aim to provide this report on a weekly basis, with a look at the previous weeks data and more historical data to compare and contrast.
This will allow contributors and 'employees' of utopian.io to keep in touch with how the platform is progressing with regards to approval percentages and number of Contribution types being submitted.
Assumptions
In this report, 'Approved' contributions have been voted on by @utopian-io.
'Rejected' contributions have not received a vote from @utopian-io.
1. Contributions Summary
For the week, 5th - 11th January 2018 inclusive, the SteemSQL DataBase holds a total of 4845 potential contributions to utopian-io. This is only a 3.6 % increase on the previous weeks' total which was 4676.
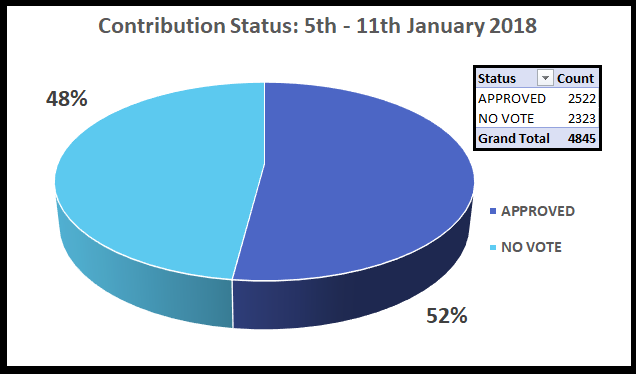
2522 of these contributions have been approved, over 400 LESS contributions than the previous weeks' total of 2976.
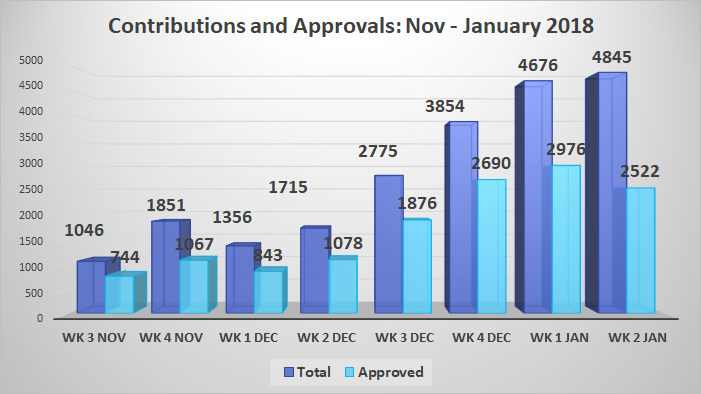
The approval percentage of 52% is down 12% from last week which is a considerable fall in the success rate of accepted contributions.
And as this chart shows, this is the lowest approval rate for a given week since the utopian-io project began.
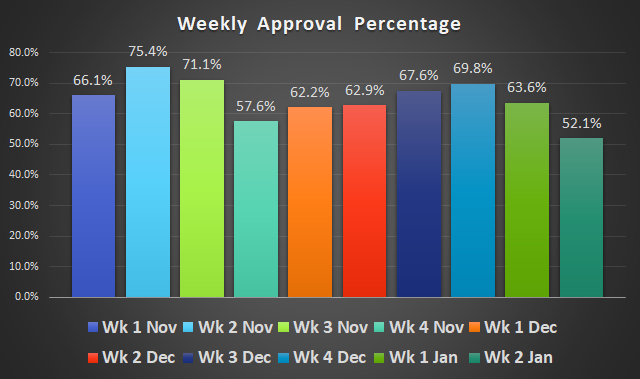
More on this later in the report.
The Contributions offered can be any one of the following types:
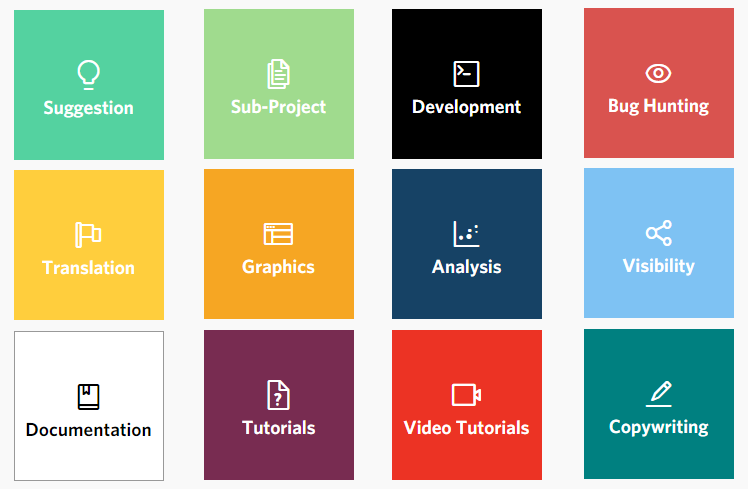
This weeks data, split into Contribution types is shown in the pie chart below:
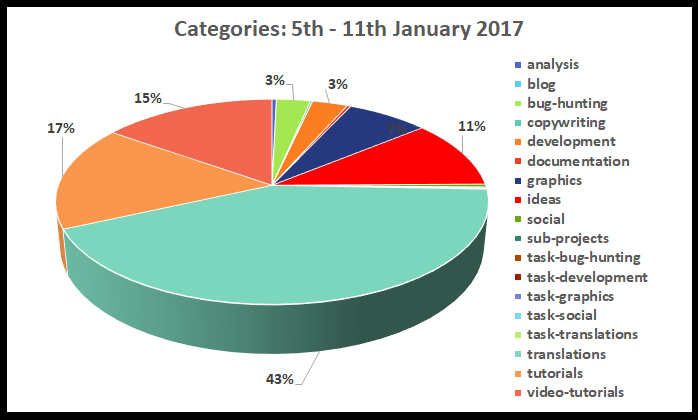
This week, the 'Translations' category still holds the largest percentage of contributions at 42%, but this has fallen 12% in the past week. Tutorial and Video-tutorials hold the 2nd and 3rd largest percentage, as they did previously.
2 Contributions by Type
In this section we take a look a few of the individual contribution types of interest.
A full list of contribution types is listed further below with associated figures and analysis.
Translations - Approvals / Rejections
The 'Translations' category is has been a hot topic in the utopian-io project recently. On the 9th January, utopian-io took the decision to 'pause' Translation contributions which they cleared the backlog and worked on adjustments to the submission rules.
Therefore, it is likely that we see a different set of data for the category this week, as has been the case thus far for the overall contribution types, and approval percentages.
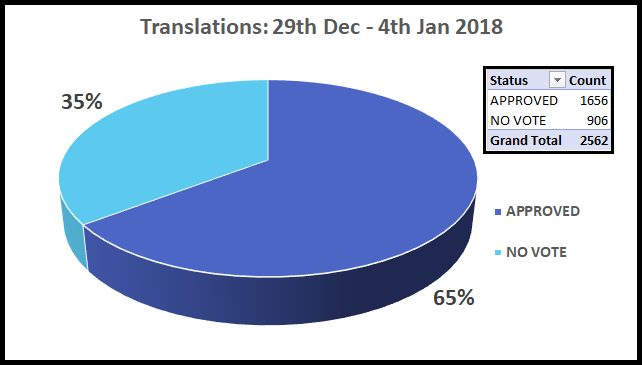
If we compare this weeks chart and the previous weeks', week can see almost 500 less submissions, but perhaps more importantly, a 9% fall in approval success rate. Last week, the approval % in this category fell 12% - which is 19% in just 2 weeks.
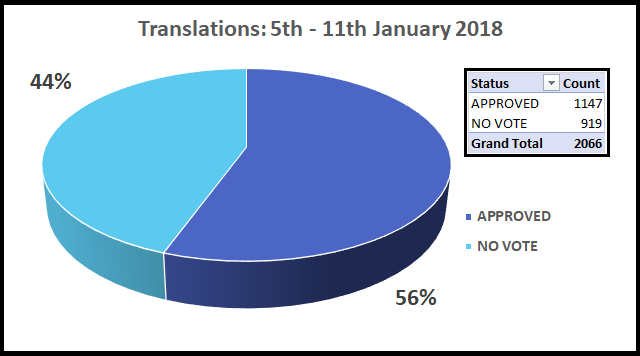
As stated, the approval percentage for 'Translations' took a fall again this week. However, we cannot say that the submission 'pause' has affected the approval percentages. It is more likely that the rule adjustments for the category have made it tougher to gain approval.
Previously, the 'Translations' category was seeing exponential growth as the contribution numbers and approval percentages were doubling each week.
However, for the past two weeks this has not been the case as we can see from the chart and graph below.
| N3 | N4 | D1 | D2 | D3 | D4 | J1 | J2 |
|---|---|---|---|---|---|---|---|
| 141 | 184 | 241 | 436 | 939 | 1932 | 2562 | 2066 |
| 105 | 107 | 188 | 328 | 718 | 1492 | 1656 | 1147 |
| 74% | 58% | 78% | 75% | 76% | 77% | 65% | 56% |
Two weeks ago the exponential increase was not continued, and indeed this week, the both the approval rate and submission rates have fallen (separate reasons as above)
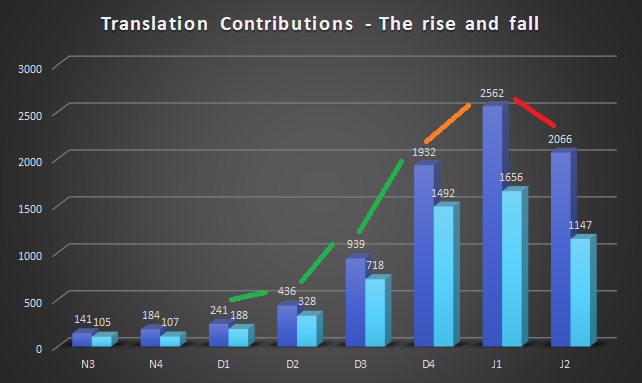
The main reason for the fall in submissions was the January 9th 'pause'.
The likely reasons for the fall in approval rates are the new rules in place, which include:
Minimum 1000 words translated, unless the entire project has a total amount of words smaller than 1000. Rewards will be increased accordingly.
Translations that are obviously machine translated or where the moderator recognizes low quality will be rejected immediately,
Personally, I feel that stricter rules did need to be introduced, and I welcome these changes.
3. All contribution types
The following table shows all types and totals of contributions submitted, with their approval % in the end column.
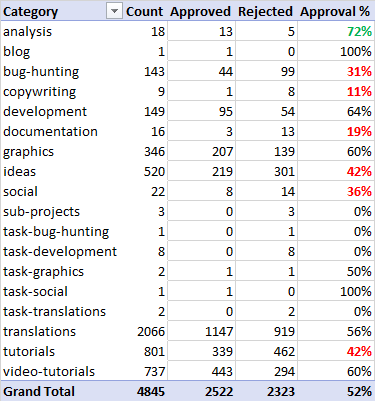
'Analysis' fared best of the busier contribution categories, but still didn't make the standard of 3 from 4 contributions.
Many popular submission categories fell short of a 50% approval rate this week.
'Bug-hunting', 'Ideas', 'Social', and 'Tutorials' contributions finished below 50% approval with 'Documentation' and 'Copywriting' scoring less than 1 in 5 approvals per submission.
4. Summary Analysis
As the weeks' pass and the data collected expands, it is possible to learn more about the developing trends in the utopian-io ecosystem.
The number of contributions continues to rise week-by-week but at a much slower rate than in the past. In addition to this , the number of accepted contributions has fallen compared to the previous week for the first time since the project began.
| - | NOV 2 | NOV 3 | N 4 (10 day) | DEC 1 | DEC 2 | DEC 3 | DEC 4 | JAN 1 | JAN 2 |
|---|---|---|---|---|---|---|---|---|---|
| Total | 655 | 1046 | 1851 | 1356 | 1715 | 2775 | 3854 | 4676 | 4845 |
| Approved | 494 | 744 | 1067 | 843 | 1078 | 1876 | 2690 | 2976 | 2522 |
The numbers this week fell short of predicted targets, particularly with regards to the number of approvals.
Looking at the data, I suggest that we may be nearing a maximum total of contributions each week of around 5000, perhaps with around 55-60% of these contributions receiving approval.
Summary
Previously:
I find it difficult to believe that the number of submissions, and approved submissions can continue increasing at this rate.
Although the above is true, we still saw a small increase in the total number of submissions from the previous week.
Also:
In light of the recent news regarding 'Translation' contributions, we could see a fall in the total number of approvals next week which would be a first for utopian-io.
This prediction has turned out to be true following the fall this week.
And:
However, it is a possibility that other categories will see an increase in contributions as content creators seek to continue providing 'proof-of-brain' to utopian-io, and the Steem Blockchain.
And in fact, utopian-io received almost double the amount of 'Bug-hunting' submissions, and saw large increases in 'Tutorials' and 'Video-tutorials, which together totaled over 1500 contributions.
'Graphics' and 'Ideas' contributions also rose sharply, but the common result with each of these categories is that the approval percentage has fallen for all.
It seems that the new rules in place for submissions as a whole, has made gaining approval more difficult.
Quality improvement
As the project matures, it is key that the quality of work rises. utopian-io has made adjustments to allow this to happen,
Although gaining approval may have become harder, with over 2000 approvals in the past week, there is still a lot of work being moderated and accepted into utopian-io.
5. Tools used to gather this data and compile report
The data is sourced from SteemSQL - A publicly available SQL database with all the blockchain data held within (Data is normally 1/2 hours delayed from live)
The SQL queries to extra to the data have been produced in both SQL Server Personal Edition and LINQPAD 5. Some of the code used for these results can be found in an earlier contribution.
The charts used to present the data were produced using MS Excel.
This data was compiled on the 14th January 2018 at 9:00 pm CET
I am part of a Steemit Business Intelligence community. We all post under the tag #blockchainbi. If you have analysis you would like to be carried out on utopian-io/Steem data, please do contact me or any of the #blockchainbi team and we will do our best to help you.
Thanks
Asher @abh12345
Posted on Utopian.io - Rewarding Open Source Contributors