This is an analysis of the Contribution types, and approval/rejection numbers for 9th - 15th February 2018 inclusive.
Contents
General / Assumptions
Contributions Summary
Contributions by Type
All contribution Types
Summary Analysis
Tools used to gather data and compile report
General
@utopian-io is the open source project for open source projects, housed on the Steem Blockchain.
Currently, @utopian.io holds over 3.5 million Steem power through delegations from its kind sponsors.
To become a sponsor and view the current standings visit https://utopian.io/sponsors
This report is an analysis of the number and type of contributions sent for review, and the success/fail rate of each contribution type.
Recent reports of this type are listed here.
October 2017
November 2017 - Week 1
November 2017 - Week 2
November 2017 - Week 3
November 2017 - Week 4
December 2017 - Week 1
December 2017 - Week 2
December 2017 - Week 3
December 2017 - Week 4
January 2018 - Week 1
January 2018 - Week 2
January 2018 - Week 3
January 2018 - Week 4
January 2018 - Week 5
February 2018 - Week 1
I will aim to provide this report on a weekly basis, with a look at the previous weeks data and more historical data to compare and contrast.
This will allow contributors and employees of utopian.io to keep in touch with how the platform is progressing with regards to approval percentages and number of Contribution Types being submitted.
Assumptions
In this report, 'Approved' contributions have been voted on by @utopian-io.
'Rejected' contributions have not received a vote from @utopian-io.
1. Contributions Summary
For the week, 9th - 15th February 2018 inclusive, the SteemSQL DataBase holds a total of 3173 potential contributions to utopian-io. This is a 24% Increase on the previous weeks' total which was 2558.
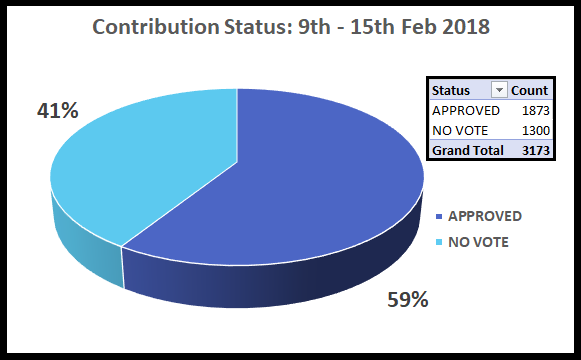
1873 of these contributions have been approved, 588 (46%) more than the previous weeks' total of 1285.
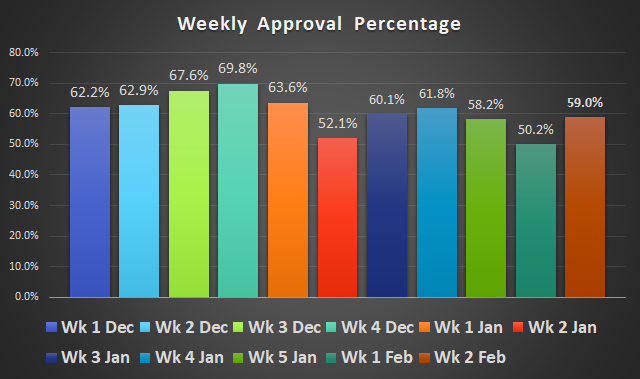
The approval percentage of 59% is up 9% from last week.
The Contributions offered can be any one of the following types:
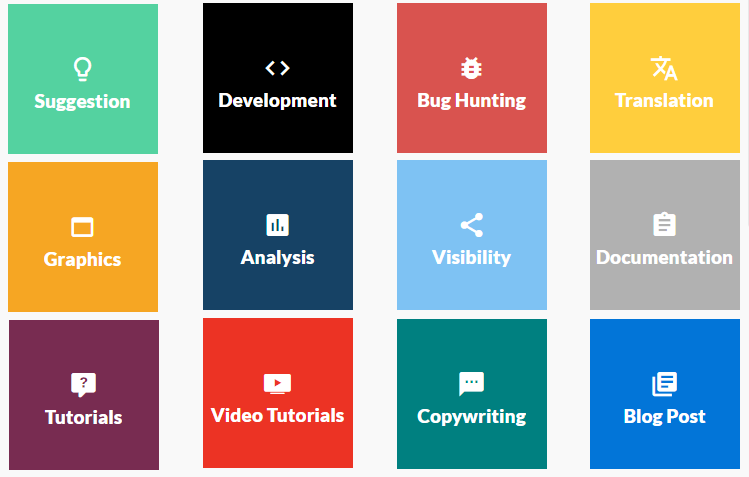
This weeks data, split into Contribution types is shown in the pie chart below:
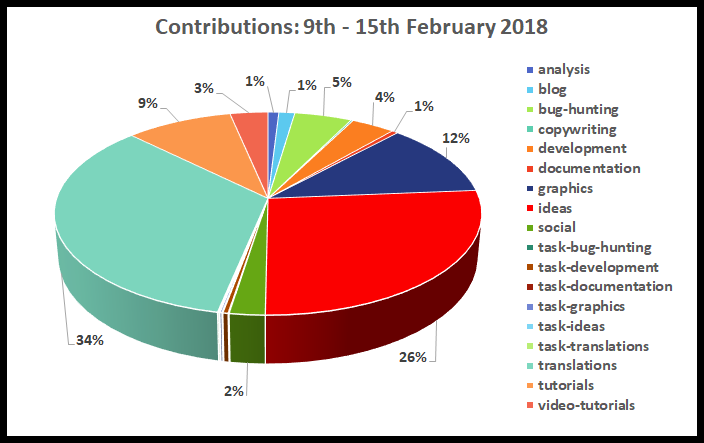
This week, 'Translations' has regained top spot at the most contributed category, 'Ideas' falls back to 2nd, and 'Graphics' holds it's position in 3rd.
2 Contributions by Type
In this section we take a look a few of the individual contribution types of interest.
A full list of contribution types is listed further below with associated figures and analysis.
Translations - Approvals / Rejections
Last week we saw a huge fall in both contributions and the success rates of these submissions, but the reverse has taken place this week.
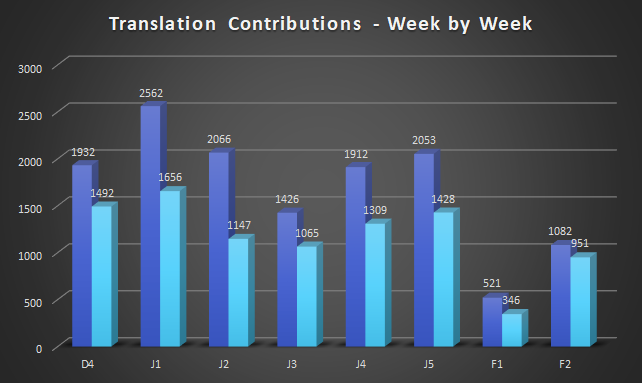
The number of submissions has more than doubled since last week, and we have an approval rate of 88%, up 22% from the previous data collection window.
Although the total submission count for 'Translations' are far from highs seen in the past, this approval percentage is the highest since the project began.
Analysis - Approvals / Rejections
This week the 'Analysis' contribution category has seen a sharp rise in submissions when compared to the last 6 weeks, this is shown in the graph below.
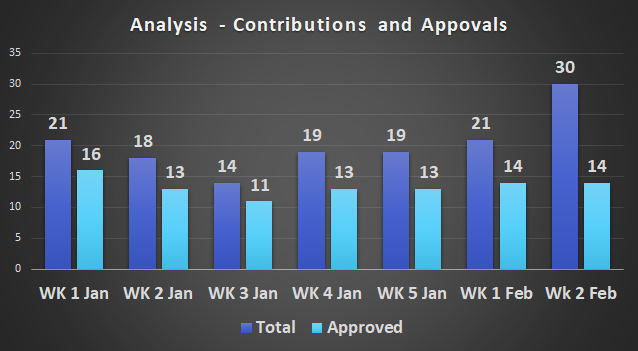
However, the rise in submissions has not been reflected in the the number of approvals, which has stayed at 14, and averages at 13.5 over the past 4 weeks of data.
Due to the approval numbers not rising this week, we are looking at an approval percentage of 47%, which is a new low for the 'Analysis' category.
3. All contribution types
The following table shows all types and totals of contributions submitted, with their approval % in the end column.
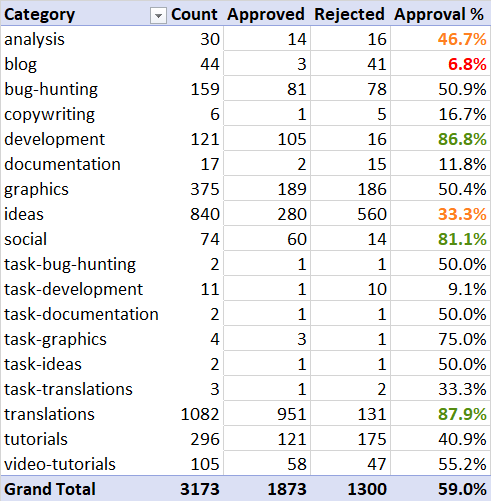
'Development' has again scored highly with an approval rate of 87%, this is an excellent result for the category, which continues it's excellent recent record of an approval rate higher than 4 out of every 5 contributions again this week.
A vast improvement on the previous week for the 'Social' contribution category with an 81% approval rate and 60 successful contributions. This is a 27% improvement on last weeks contribution success rate, and we have 26 more submissions to the category than last time.
Looking at the 'Blog' category, we see another poor week with numbers even lower than previously.
This week: 3 approvals, 6.8% success rate
Last week: 5 approvals, 10% success rate
Two weeks ago: 11 approvals , 12.5% success rate
The analyst would again like to stress that this category and its rules require review, as much time is seemingly being wasted by both the contributors and moderators.
'Bug hunting' has seen a reasonable improvement in successful contributions this week.
Previously:

This week:

This category has gained over 15% in the approval success rate compared to the previous week, which is sure to please both contributors and moderators alike.
4. Summary Analysis
As the weeks' pass and the data collected expands, it is possible to learn more about the developing trends in the utopian-io ecosystem.
This weeks contribution total is sharply up from the previous week, but still noticeably short of the majority of weeks prior to this.
| _ | DEC 4 | JAN 1 | JAN 2 | JAN 3 | JAN 4 | JAN 5 | FEB 1 | FEB 2 |
|---|---|---|---|---|---|---|---|---|
| Total | 3854 | 4676 | 4845 | 3511 | 4491 | 4722 | 2258 | 3173 |
| App'd | 2690 | 2976 | 2522 | 2110 | 2774 | 2747 | 1285 | 1873 |
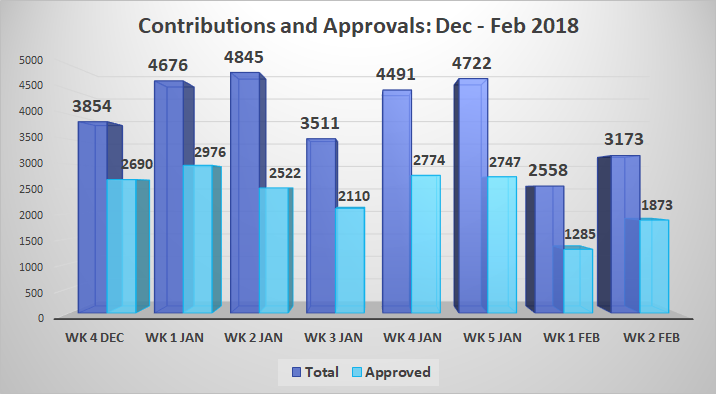
The analyst has long suggested that 5000 contributions may be a barrier to the weekly submissions total, and although we can see an improvement in numbers this week, 5000 looks a fair distance away yet.
However, with a 59% approval percentage this week, this sits nicely in the range of 55-65% as suggested by the analyst to be the on-going average approval percentage.
Summary
This past week has been better week for contributors to utopian-io. Following recent rule updates which certainly affected last weeks' figures, it seems that adoption and understanding of the changes has taken place.
Previously I wrote:
Lets hope to see an improvement in contributions and an increase in the approval percentage over the coming weeks as the new rules are slowly adapted to.
The analyst is happy to report that this has been the case and considers this past week to have been a good one for @utopian-io, and a solid foundation to build on again next week.
5. Tools used to gather this data and compile report
The data is sourced from SteemSQL - A publicly available SQL database with all the blockchain data held within.
The SQL queries to extra to the data have been produced in both SQL Server Personal Edition and LINQPAD 5. Some of the code used for these results can be found in an earlier contribution.
The charts used to present the data were produced using MS Excel.
This data was compiled on the 20th February 2018 at 10:00am (UCT)
I am part of a Steemit Business Intelligence community. We all post under the tag #blockchainbi. If you have analysis you would like to be carried out on utopian-io/Steem data, please do contact me or any of the #blockchainbi team and we will do our best to help you.
Thanks
Asher @abh12345
Posted on Utopian.io - Rewarding Open Source Contributors