This is an analysis of the Contribution types, and approval/rejection numbers for 23rd Feb - 1st March inclusive.
Contents
General / Assumptions
Contributions Summary
Contributions by Type
All contribution Types
Summary Analysis
Tools used to gather data and compile report
General
@utopian-io is the open source project for open source projects, housed on the Steem Blockchain.
Currently, @utopian.io holds over 3.8 million Steem power through delegations from its kind sponsors.
To become a sponsor and view the current standings visit https://utopian.io/sponsors
This report is an analysis of the number and type of contributions sent for review, and the success/fail rate of each contribution type.
Recent reports of this type are listed here.
OCT 2017: October 2017
NOV 2017: Week 1 - Week 2 - Week 3 - Week 4
DEC 2017: Week 1 - Week 2 - Week 3 - Week 4
JAN 2018: Week 1 - Week 2 - Week 3 - Week 4 - Week 5
FEB 2018: Week 1 - Week 2 - Week 3
I will aim to provide this report on a weekly basis, with a look at the previous weeks data and more historical data to compare and contrast.
This will allow contributors and employees of utopian.io to keep in touch with how the platform is progressing with regards to approval percentages and number of Contribution Types being submitted.
Assumptions
In this report, 'Approved' contributions have been voted on by @utopian-io.
'Rejected' contributions have not received a vote from @utopian-io.
1. Contributions Summary
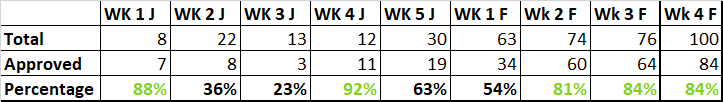
For the week, 23rd Feb - 1st March 2018 inclusive, the SteemSQL DataBase holds a total of 3270 potential contributions to utopian-io. This is 72 more contributions than the previous weeks' total which was 3198.
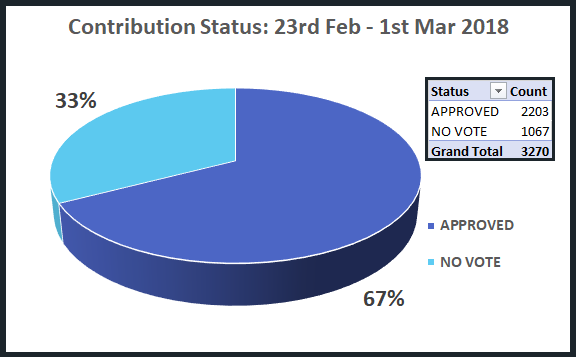
2203 of these contributions have been approved, ** 9% more** than the previous weeks' total of 2023.
The approval percentage of 67% is up 4% from last week.
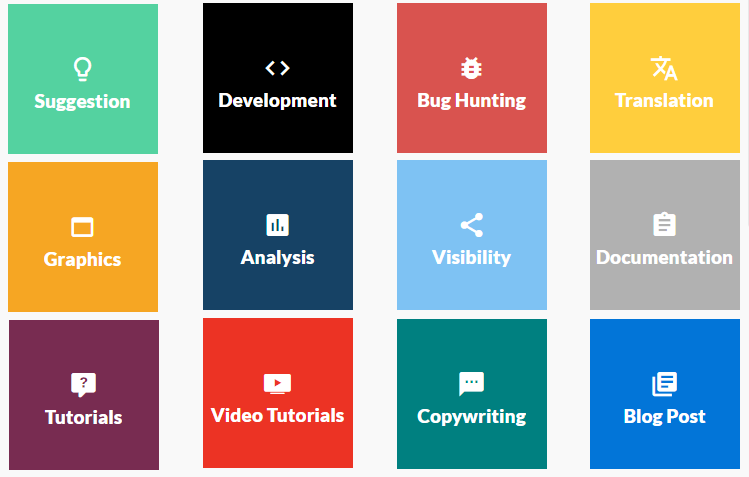
The Contributions offered can be any one of the following types:
This weeks data, split into Contribution types is shown in the pie chart below:
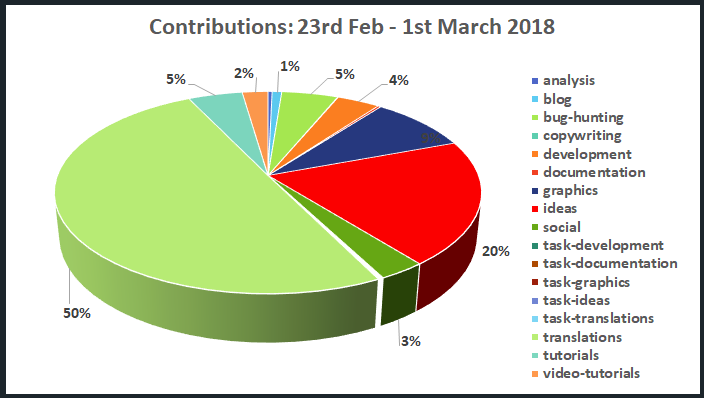
'Translations', as has been the case for the previous 2 weeks, is the category containing the most contributions (1642), and holds exactly half of this week's contributions, at 50%,
And as last week, 'Ideas/Suggestions' (652) are in 2nd, and 'Graphics' (292) in 3rd place.
2 Contributions by Type
In this section we take a look a few of the individual contribution types of interest.
A full list of contribution types is listed further below with associated figures and analysis.
Translations - Approvals / Rejections
This week, 'Translation' contributions provided half of all the submissions to utopian-io. The number of contributions within this category has grown again, for the 3rd consecutive week, as can be seen in the chart below.
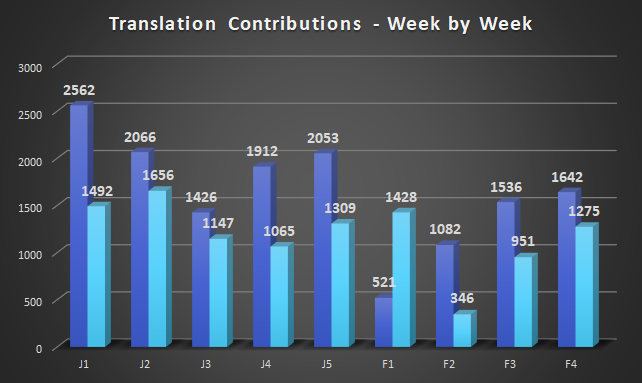
Although the contributions are increase, the weekly totals seem to leveling off and look unlikely to reach the numbers seen in January.
Again, the approval % sits in the 80s, with over 4 in 5 contributions being accepted for this category, and an approval % of 85% makes 'Translations' the category (excluding categories with less than 10 submissions) with the highest approval rate this week.
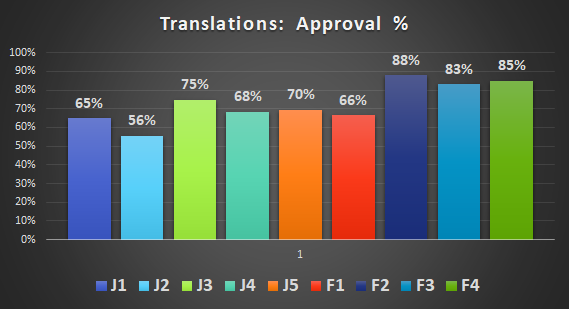
Since the rule changes at the end of January this category is performing well. It's clear that the number of substandard contributions has fallen right down, and there is a good understanding of what is required to produce work of value.
Analysis - Approvals / Rejections
The 'Analysis' contribution category has seen submissions fall recently. A total of 12 this week, with only 6 approvals makes this the 2nd week in a row with less than double digit accepted contributions, and 6 is the lowest approval total in 2018.
The average approval total for the year so far is 12 contributions a week and so we can see a sharp reduction in that for the past two weeks on the chart below.
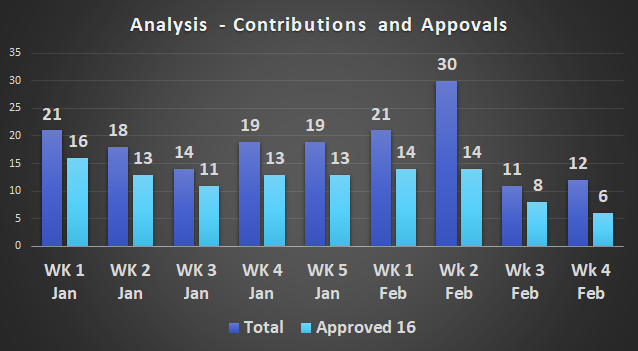
A 50% approval rate is the 2nd lowest in 2018.
Social - Approvals / Rejections
The 'Social' contribution category has received 100 contributions this week, and 84 of those have been approved. This is a good approval rate and the category continues to progress.
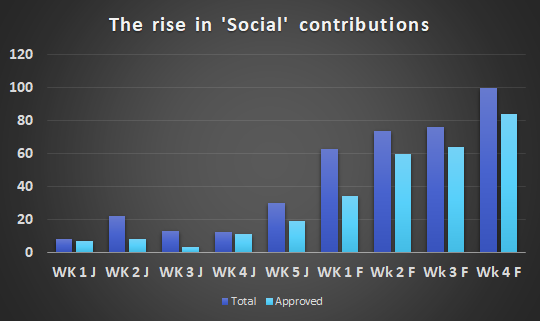
Looking at the chart and table above, we can see that the total submissions has grown week on week for the past 6 weeks, and the number of accepted contributions for the past 5.
Promoting Open Source projects like utopian-io, dtube, dlive, and steem/steemit has become more of a priority among the communities associated with them in 2018. And with utopian-io rewarding the promotion of these projects, the 'Social' category has seen it's status grow this year.
3. All contribution types
The following table shows all types and totals of contributions submitted, with their approval % in the end column.
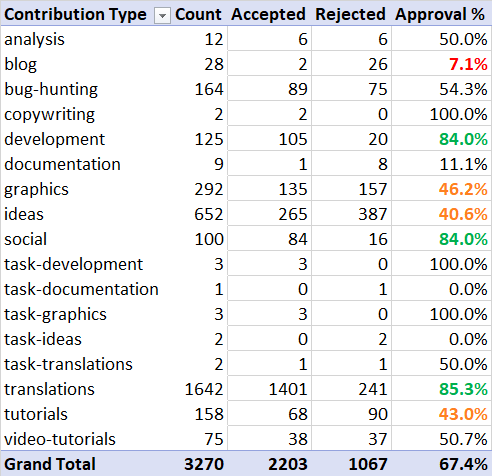
'Development', Social', and 'Transactions' categories all performed excellently this week with 84%, 84%, and 85% respective approval rates.
Another poor week for the 'Blog' category with just a 7.1% approval percentage and 2 approvals, the recent figures showing this to be even lower than the average, which still stands out as being poor.
This week: 2 approvals, 7.1% success rate
Last week: 5 approvals, 12.5% success rate
Two weeks ago: 3 approvals, 6.8% success rate
Three weeks ago: 5 approvals, 10% success rate
Four weeks ago: 11 approvals, 12.5% success rate
The 'Bug hunting' approval percentage rose 18% this week, but seems to have not found a steady approval % week on week.
'Tutorials' and 'Video Tutorials' have both suffered as far as approval %'s this week and will be in focus next week.
4. Summary Analysis
Each week provides an expanding dataset, and from this it is possible to learn more about the developing trends in the utopian-io ecosystem.
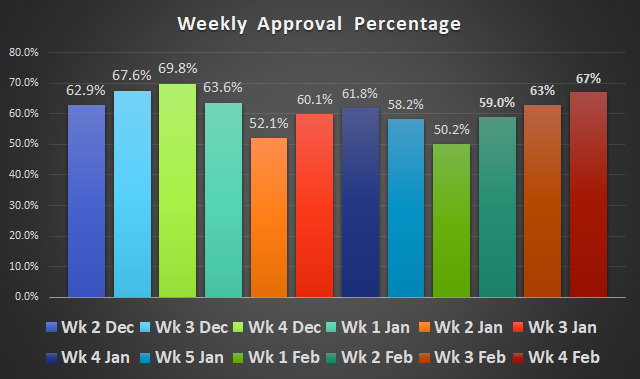
This weeks totals however are in keeping with recent data and show a settled view of the utopian-io project. Another 4% rise (same as last week) in the accepted contributions is an excellent result and should bring good cheer to all involved.
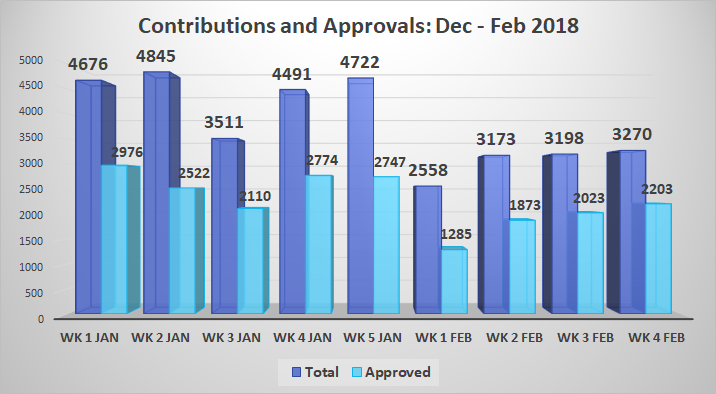
A steady, rising trend looks very healthy, which can been seen in the chart below, and is particularly clear to spot for the month of February.
Summary
This past week has again seen another improvement for the contributors to utopian-io. The number of approved contributions has risen again, which is also good for the moderators of utopian-io, as it means they are not suffering though as much poor quality contributions.
Previously I wrote:
... [the Analyst] considers this past week to have been a good one for @utopian-io, and a solid foundation to build on again next week.
This comment is again true for this week and the analyst hopes to be able to repeat it again in weeks to come.
Well done to all at utopian-io for another solid week!
5. Tools used to gather this data and compile report
The data is sourced from SteemSQL - A publicly available SQL database with all the blockchain data held within.
The SQL queries to extra to the data have been produced in both SQL Server Personal Edition and LINQPAD 5. Some of the code used for these results can be found in an earlier contribution.
The charts used to present the data were produced using MS Excel.
This data was compiled on the 6th March 2018 at 11am (UCT)
I am part of a Steemit Business Intelligence community. We all post under the tag #blockchainbi. If you have analysis you would like to be carried out on utopian-io/Steem data, please do contact me or any of the #blockchainbi team and we will do our best to help you.
Thanks
Asher @abh12345
Posted on Utopian.io - Rewarding Open Source Contributors